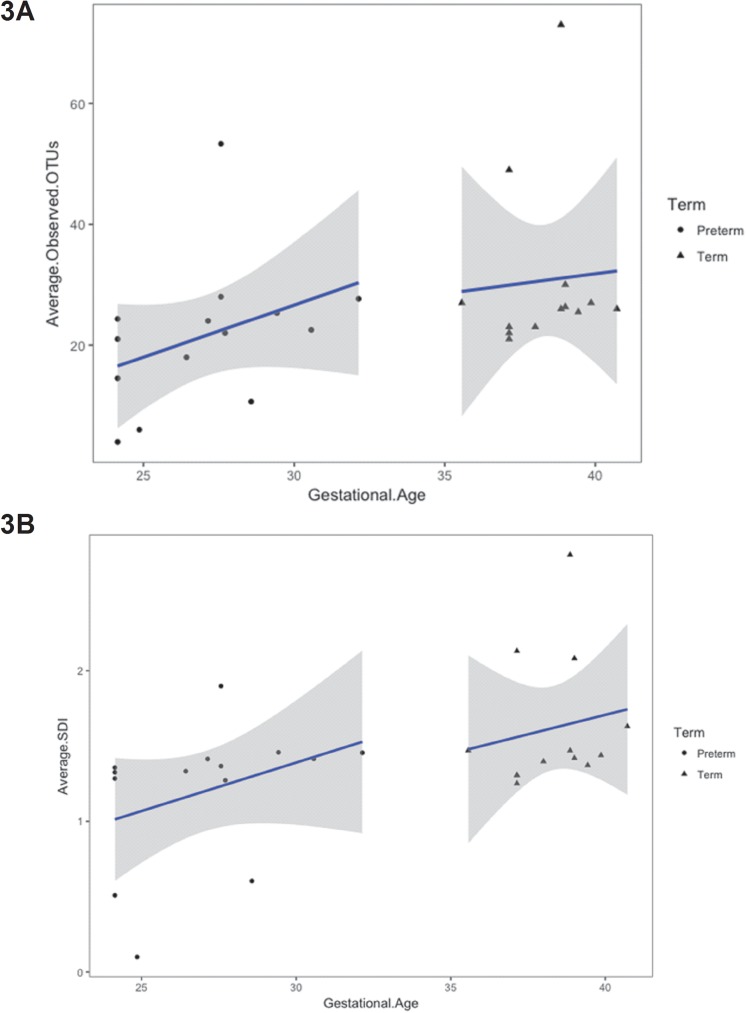
Fig 3. Gestational age is associated with the skin microbiome (at baseline) in preterm infants.
3A. Average Observed OTU: Each dot represents the average number of Operational Taxonomic Units (OTUs) for the subject, across the sites. The average OTU is linearly regressed against gestational age at baseline samples and shaded areas are the 95% confidence intervals for the regression line. Gestational age is significantly associated with average number of OTUs, when both preterm and term infants are considered together (R = 0.39, p = 0.04). 3B. Average Shannon diversity index: Each dot represents the average Shannon diversity index for the subject, across the sites. The average Shannon diversity index is linearly regressed against gestational age at baseline samples and shaded areas are the 95% confidence intervals for the regression line. Gestational age is significantly associated with average Shannon diversity index, when both preterm and term infants are considered together (R = 0.49, p < 0.009).

