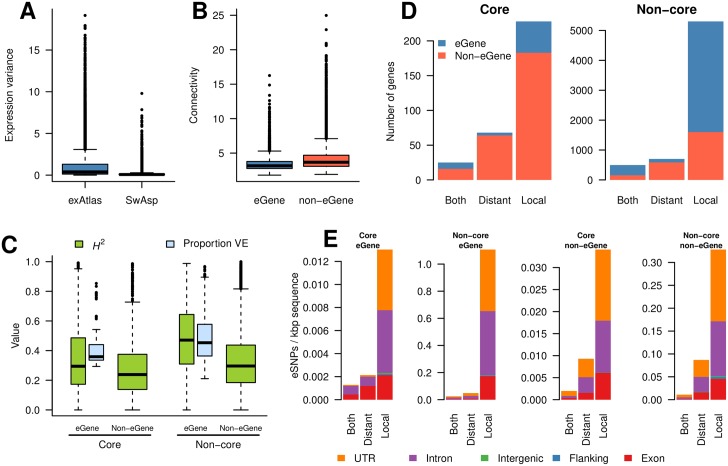
Fig 3. Co-expression characteristics of eGenes and eSNPs.
(A) Gene expression variance distribution for all genes in the SwAsp data (before removal of hidden confounders) and the exAtlas data. (B) Distribution of co-expression connectivity for eGenes and non-eGenes. (C) Distributions of the proportion of total variance explained and heritability for eGenes and non-eGenes divided into core and non-core genes. (D) Genes having distantly, locally, or both distantly and locally acting eSNPs located within 2 kbp (or inside) the gene divided into core and non-core genes. (E) Genomic context of distantly, locally, or both distantly and locally acting eSNPs located within 2 kbp of an eGene divided into core and non-core eGenes. The eSNP counts are normalised for total feature length.

