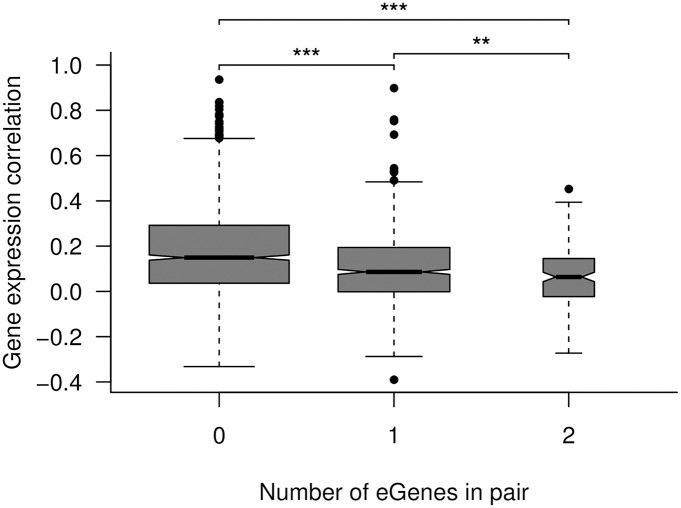
Fig 4. Correlation within paralog pairs as a function of the number of eGenes in the paralog pair.
The widths of the boxes are proportional to the number of genes in each set. The mean correlations for paralog pairs with 0, 1, or 2 eGenes were 0.17, 0.10, and 0.06, respectively. The pairwise significance of a Mann-Whitney test is indicated by asterisks: ***p < 0.001, **p < 0.01.

