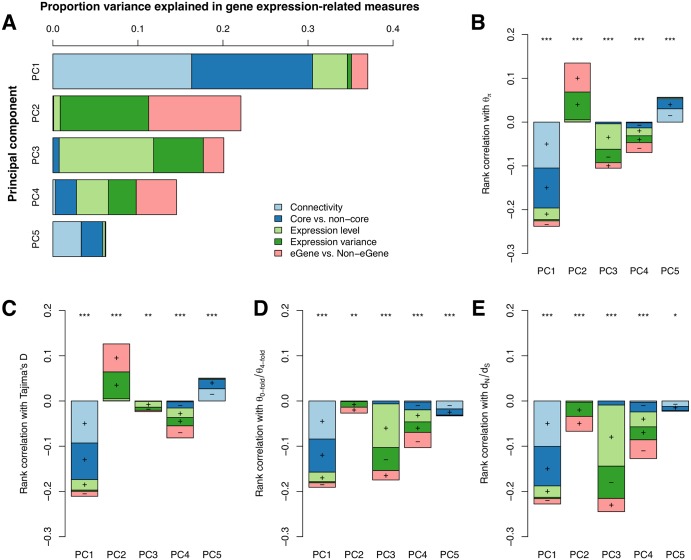
Fig 6. Associations between metrics of gene expression and sequence evolution in Populus tremula.
(A) Percentage variance explained by five principal components comprising co-expression network connectivity, genes in network cores or not (Core vs. non-core genes), gene expression levels, gene expression variance and genes with eQTLs or not (eGenes vs. non-eGenes). Colour shadings depict the proportion contribution of each gene expression measure to each principal component. (B-E) Spearman’s rank correlations between PCs and four metrics of sequence evolution: nucleotide diversity (θπ), Tajima’s D, θ0-fold/θ4-fold and dN/dS. Stacking of the barplots shows the relative contribution of each gene expression measure to each PC. Plus or minus indicates the direction of correlation for individual variable on the corresponding PCs. Asterisks indicate significant correlations, ***P < 1e-5, **P < 0.001,*P<0.05, ns = not significant (P >0.05).

