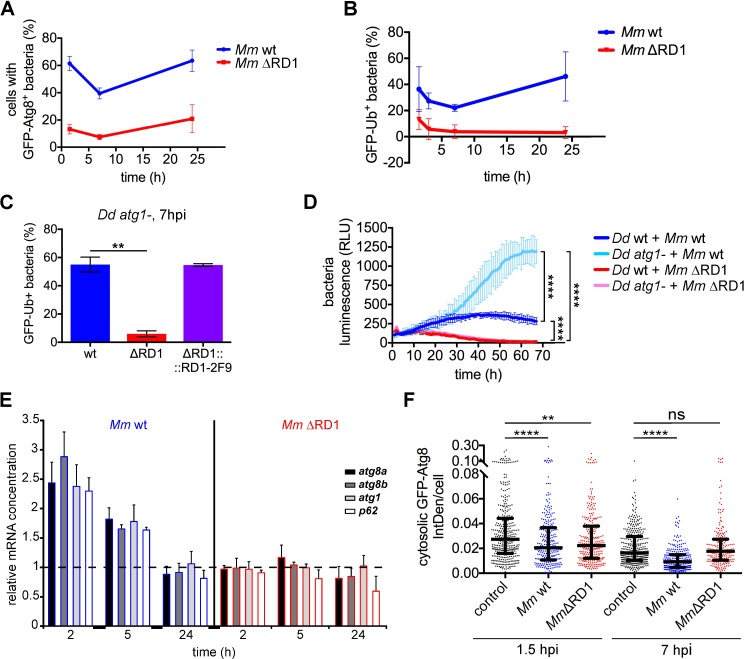
Fig 4. The early autophagic response caused by M. marinum infection is dependent on ESX-1.
A. Percentage of cells containing GFP-Atg8+ M. marinum wt and ΔRD1 at 1.5, 7 and 24 hpi. Means and standard deviations from independent triplicates. A mean of 375 and 230 infected cells per time point was counted for M. marinum wt and ΔRD1 infection, respectively; B. Percentage of M. marinum wt and ΔRD1 bacteria positive for GFP-Ub. Mean and standard deviation from independent triplicates; C. GFP-Ub-expressing atg1- cells were infected with Vibrant DyeCycle Ruby-labelled M. marinum wt, ΔRD1 and ΔRD1::2F9. Means and standard deviations from independent duplicates of the percentage of bacteria positive for GFP-Ub at 7 hpi. A mean of 72–98 bacteria per infection was counted. Unpaired t test (**p ≤ 0.01); D. D. discoideum wt and atg1- cells were infected with lux-expressing M. marinum wt and ΔRD1. The intracellular bacteria growth (RLUs) from triplicates was monitored. Statistical differences at the end of the experiment were calculated with a Bonferroni post hoc test after two-way ANOVA (****p ≤ 0.0001); E. qPCR results of relative abundance of atg8a, atg8b, atg1 and p62 mRNAs at 2, 5 and 24 hpi with M. marinum wt (blue outline) and ΔRD1 (red outline). The mRNA level in non-infected cells is indicated as 1 in the figure (dashed line). The mRNA level of the housekeeping gene gapdh was used for normalization. Means and standard deviations from three independent experiments performed in triplicates are represented; F. GFP-Atg8-expressing cells were infected or mock-infected for 1.5 or 7 h with mCherry-expressing M. marinum wt or with DsRed-expressing M. marinum ΔRD1. Maximum projections were used to measure the Integrated Density (IntDen) of the cytosolic GFP-Atg8 fluorescence compared to the extracellular IntDen (background). Median with interquartile ranges of the cytosolic GFP-Atg8 IntDen per cell. Each dot represents one cell. 210–357 cells per condition from three independent experiments were counted. Mann-Whitney test (****p ≤ 0.0001; **p ≤ 0.01; ns, p > 0.05).

