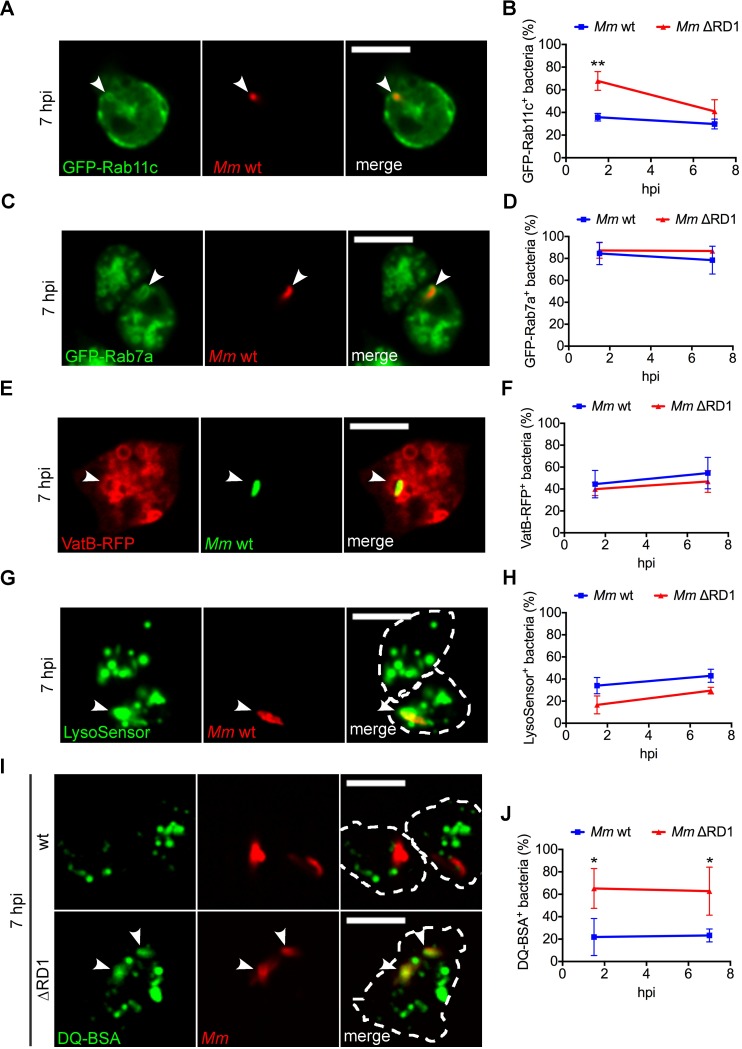
Fig 5. Expression of ESX-1 is essential to devoid the MCV of proteolytic activity.
Cells expressing GFP-Rab11c, GFP-Rab7a or VatB-RFP, or incubated with LysoSensor Green or DQ Green BSA were infected for 1.5 and 7h with M. marinum wt or ΔRD1 labelled with Vibrant DyeCycle Ruby or expressing mCherry, DsRed or GFP. Representative sections of live imaging at 7 hpi are shown in A, C, E, G and I. White arrowheads point to the sites of recruitment/co-localization to the MCV. Scale bars, 10 μm; The percentage of bacteria/MCVs positive for GFP-Rab11c (B), GFP-Rab7a (D), VatB-RFP (F), LysoSensor Green (H) or DQ Green BSA (J) at 1.5 and 7 hpi was quantified. Mean and standard deviation from 2–3 independent experiments. A minimum of 100 infected cells were counted for each cell line. Unpaired t test compared wt and ΔRD1 bacteria (*p ≤ 0.05; **p ≤ 0.01).

