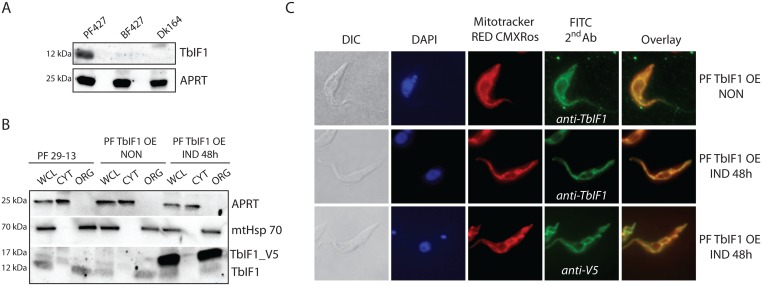
Fig 2. TbIF1 expression is only detected in PF T. brucei, where it is localized to the mitochondrion.
(A) The steady state abundance of TbIF1 was determined in T. brucei PF427, BF427 and Dk164 whole cell lysates by western blot analysis using a specific polyclonal anti-TbIF1 antiserum. An anti-APRT1 antiserum was used to estimate equal protein loading on SDS-PAGE. The molecular weight of the detected proteins is indicated on the left. (B) TbIF1 subcellular localization was determined in PF 29–13 and PF TbIF1 OE cells either noninduced (NON) or expressing V5-tagged TbIF1 for 48 hours (IND 48h). Whole cell lysates (WCL) and digitonin extracted cytosolic (CYT) and organellar (ORG) fractions were analyzed by immunoblot with the following antibodies: anti-APRT (cytosol), anti-mtHsp70 (organellar fraction), anti-V5 and anti-TbIF1. (C) Immunofluorescence assays with a fluorescein isothiocyanate (FITC)-conjugated secondary antibody that recognizes primary antibodies detecting either all TbIF1 variants (anti-TbIF1) or just the ectopic V5-tagged TbIF1 (anti-V5) further verify that the protein is targeted to the mitochondrion in PF TbIF1 OE cells induced for 48 hours (IND 48h). Noninduced (NON) PF TbIF1 OE cells were included as a control, while the DNA contents and single reticulated mitochondrion were visualized using DAPI (4,6-diamidino-2-phenylindole) and MitoTracker Red CMXRos staining, respectively. The overall cell morphology is depicted in the differential interference contrast (DIC) microscopy images.

