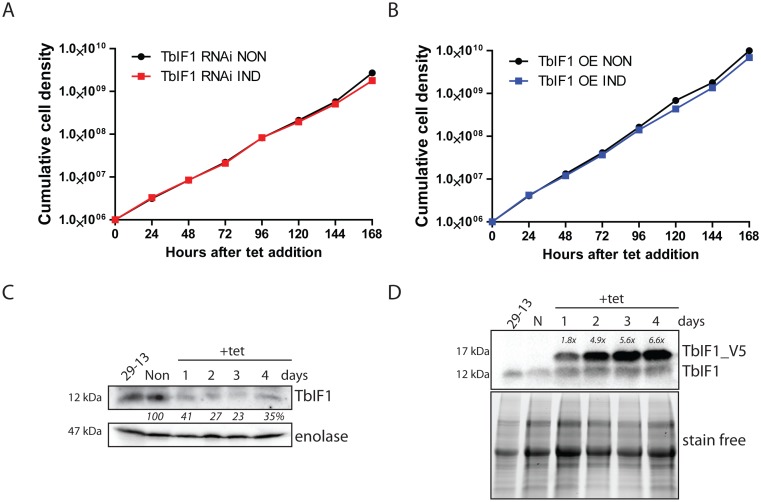
Fig 3. Neither TbIF1 silencing nor overexpression are harmful to PF T. brucei cells grown in vitro.
(A) TbIF1 RNAi noninduced (NON) and induced (IND) cells were maintained in the exponential growth phase (between 106 and 107 cells/ml) and the cumulative cell number represents the normalization of cell densities by factoring in the daily dilution factor. The figure is representative of three independent RNAi inductions. B) The growth rate of cells either induced (IND) or noninduced (NON) for TbIF1 OE were determined in the same manner as in A. C) The steady-state abundance of TbIF1 in the parental cell line (29–13), TbIF1 RNAi noninduced (NON) and cells induced (IND) with tet for 1, 2, 3 and 4 days was determined by western blot analysis using a specific TbIF1 antiserum. Cytosolic enolase served as a loading control. The numbers depicted underneath the top panel represent the abundance of immunodetected protein as a percentage of the noninduced samples after normalizing to the loading control. D) Ectopic V5-tagged TbIF1 expression was confirmed by western blot analysis using whole cell lysates from PF 29–13, noninduced (NON) TbIF1 OE and cells induced (IND) for 1, 2, 3 and 4 days. The endogenous TbIF1 and the V5-tagged ectopic protein were visualized using a polyclonal TbIF1 antiserum. Comparable loading was confirmed by Bio-Rad TGX stain-free technology. Levels of V5-tagged TbIF1 overexpression as compared to the endogenous TbIF1 are indicated at the top of the immunoblot.

