
Figure 1. Screen for modulators of ppGalNAc-T2/T3.
(A) Diagram showing sensor design and the linker sequences used. O-glycosylation of the linker masks the furin site but if an inhibitor blocks the ppGalNAc-transferase then furin cleaves the linker releasing the blocking domain (BD) allowing fluorescent activating protein (FAP) dimerization and dye activation. Linker furin sites are underlined and sites of glycosylation or mutation are in bold. (B) HEK cell lines with or without ppGalNAc-T2 or T3 stably expressing the WT or ∆glycan T2 or T3 sensor constructs (see linkers in A) were imaged in the presence of 110 nM of the dye MG11p (MG) to detect GFP or MG. Bar = 20 µm. (C) Schematic showing cell plating, drug treatment, cell release, fluorescence measurement and parallel analysis using both T2 and T3 sensors. Hits that activate both may be pan-specific or act on off-target pathways common to both sensors whereas sensor specific hits are likely acting directly on the corresponding ppGalNAc-transferase. (D) The plot shows Q values (Q=(R-RNeg)/SDNeg) for each compound (treatment at 10 µM for 6 hr) using the average of duplicate MG/GFP ratios for the compound (R), the vehicle-only control (RNeg), and the standard deviation of the vehicle-only controls (SDNeg). The cut-off values of +3 and −2.5 are indicated (*). Also indicated are the values for the positive controls (T2∆glycan and T3∆glycan) and the structure of the indicated T3-specific hit (inset). (E) Values (% enzyme activity relative to vehicle-only controls) in the in vitro assay using purified ppGalNAc-T2 or T3 as a secondary screen are shown for 20 hits from the primary screen. Compounds were present at 50 µM. Compound 1614 is T3Inh-1.
DOI: http://dx.doi.org/10.7554/eLife.24051.003

Figure 1—figure supplement 1. Cell growth at various T3Inh-1 exposures.
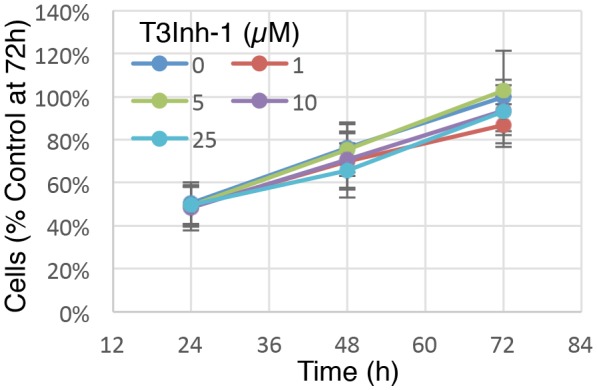
Figure 1—figure supplement 2. General N- and O-glycosylation are unaffected.

Figure 1—figure supplement 3. ppGalNAc-transferase levels are unaffected.
