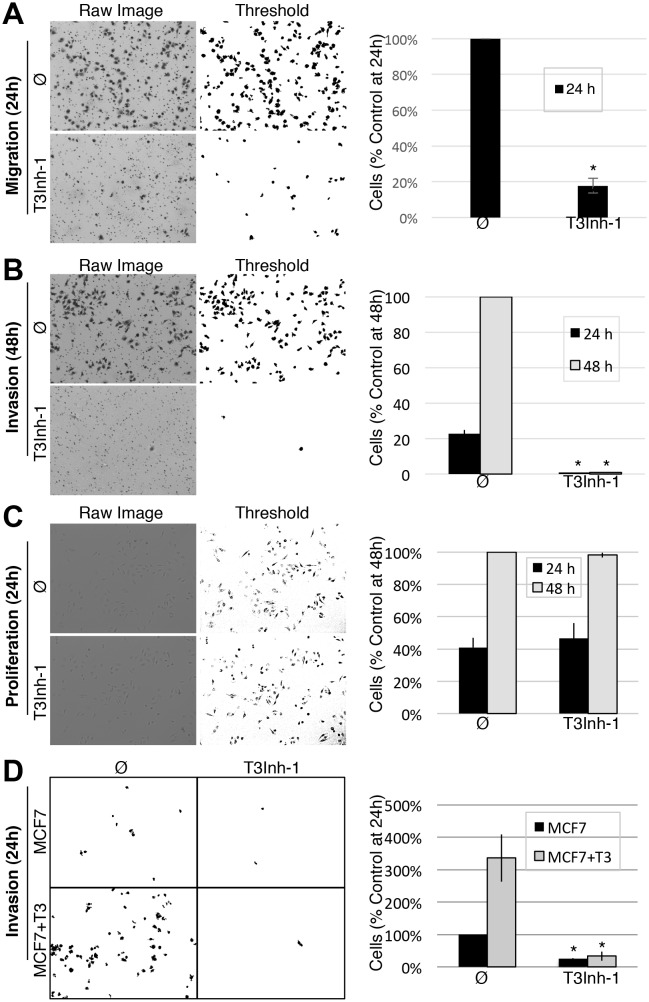
Figure 3. T3Inh-1 inhibits cell invasion.
(A) Cell migration through uncoated filters was determined for the MDA-MB231 breast cancer cell line grown in the absence or presence of 5 µM T3Inh-1. The raw image of the filter shows both cells and the filter holes whereas a size-cut off was used in the thresholded image to specifically visualize the cells. Results were quantified by counting cells that migrated to the underside of the filter and each experiment was normalized using the average determined for controls at 24 hr (n = 3 ± SEM). (B) Identical analysis except that the filters were pre-coated with Matrigel so that the assay measures invasion not just migration and the 48 hr control was used for normalization (n = 3 ± SEM). (C) MDA-MB231 proliferation was determined for cells grown in the presence or absence of 5 µM T3Inh-1 by cell counting at 24 or 48 hr. Representative images before and after thresholding (no size cutoff) are shown as well as quantification normalized by the value determined for untreated cells at 48 hr (n = 3 ± SEM). (D) Mock and ppGalNAc-T3 transfected MCF7 cells were plated on Matrigel-coated filters in the absence or presence of 5 µM T3Inh-1 for 24 hr. Thresholded images show cells on underside of filters. Cell counts are shown relative to untreated controls after normalization using the total number of cells (determined using parallel wells 24 hr post-plating). For all panels, asterisks denote p<0.05 (two-tailed Student’s t test) for untreated to T3Inh-1 comparison.
DOI: http://dx.doi.org/10.7554/eLife.24051.018


