. 2017 Mar 31;6:e24051. doi: 10.7554/eLife.24051

Figure 4. T3Inh-1 increases cleavage of FGF23.

(A) Immunoblot of media collected from cells after a 6 hr period in the presence of the indicated concentrations of T3Inh-1. HEK cells were transfected with FLAG-FGF23 and ppGalNAc-T3 or Myc-ANGPTL3 and anti-FLAG and anti-Myc antibodies were used to assay intact (*) and cleaved (<) FGF23 and ANGPTL3, respectively. The identity and origin of the unmarked band (at approximately 25kD) is unknown and its presence was variable. (B) Quantified results showing the percent ratio change of cleaved/intact FGF23 or ANGPTL3 normalized to the amount present in untreated controls (n ≥ 3 ± SEM). (C) Serum ELISA assay results showing ratio of cleaved/intact FGF23 in mouse sera collected 24 hr after either 1 or 2 (consecutive day) intraperitoneal injections of the indicated amount of T3Inh-1 (averages of 4 animals ±SEM). P-values are from two-tailed Student’s t test.

DOI: http://dx.doi.org/10.7554/eLife.24051.024
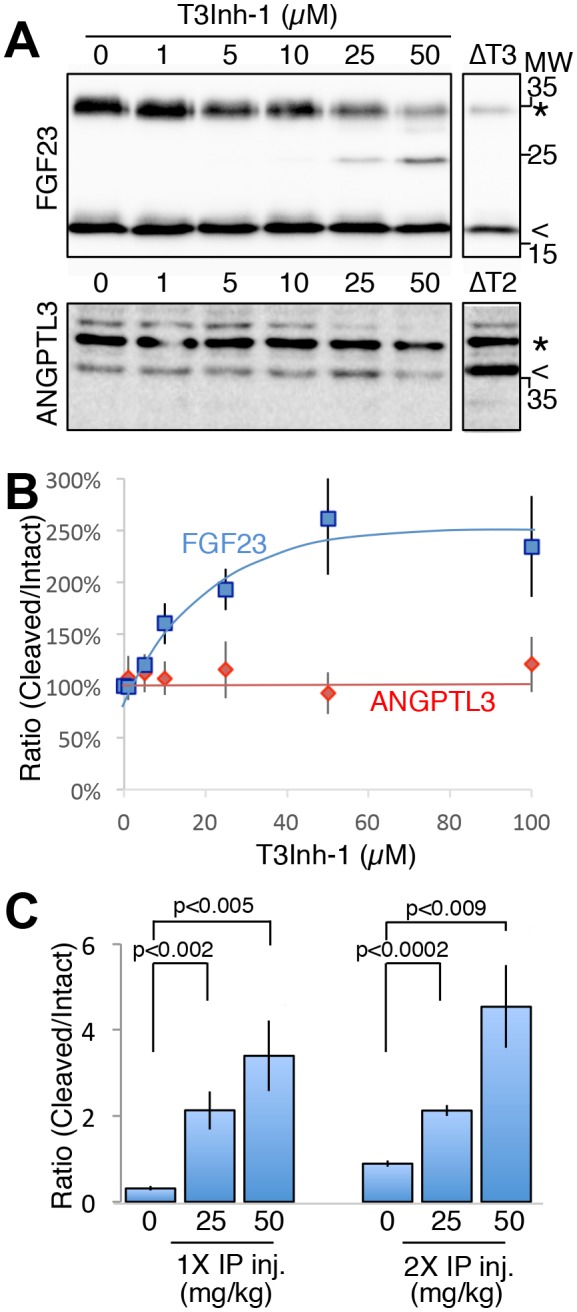
Figure 4—source data 1. Panel B: Cleaved/intact FGF23 and ANGPTL3 secreted at differing T3Inh-1 concentrations.
DOI: 10.7554/eLife.24051.025
Figure 4—source data 2. Panel C: Cleaved/intact FGF23 in mouse serum after one two T3Inh-1 injections.
DOI: 10.7554/eLife.24051.026

Figure 4.

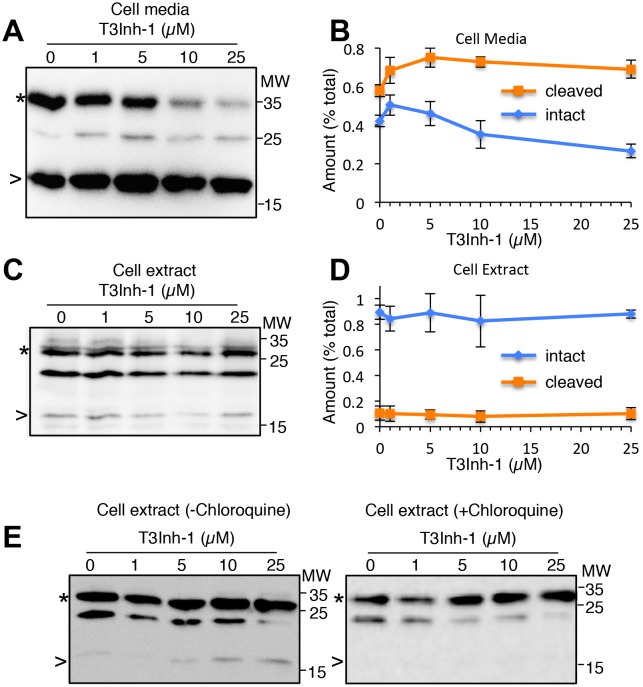
Figure 4—figure supplement 1. Secreted and cellular FGF23 after T3Inh-1 treatment.

Figure 4—figure supplement 1.

(A) Shown is an additional representative blot (see Figure 4A) of recovery of intact (*) and cleaved (>) FGF23 in the media collected from cells after a 6 hr period in the presence of the indicated concentrations of T3Inh-1. Unmarked bands here and in panels C and D were considered background because they were absent for untransfected cells. (B) Quantified results for FGF23 in the media showing the relative amounts of each band (intact and cleaved) as a percent of the total (intact+cleaved for the untreated controls). Values are averages (n = 3 ± SEM). (C–D) These panels are identical to panels A and B except that cell extracts were analyzed rather than cell media. (E) Recovery of intact (*) and cleaved (>) FGF23 in HEK cell extracts from cells treated with the indicated concentrations of T3Inh-1 for 6 hr in the absence or presence of 100 μM chloroquine.
Figure 4—figure supplement 1—source data 1. Cleaved versus intact FGF23 secreted at differing T3Inh-1 concentrations.
DOI: 10.7554/eLife.24051.028