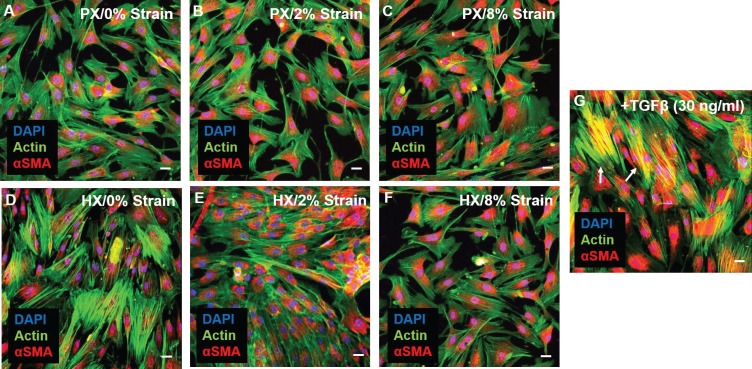
Figure 4. Representative images of CFs fixed after 24 hr combined stimulations (A–F) and stained for actin (green) and αSMA (red), nuclei were counterstained with DAPI (blue).
Scale bars = 20 μm. αSMA is similarly expressed in all conditions and diffused in perinuclear and cytoplasmic localization. (G) Positive control for αSMA immunofluorescence through stimulation with 30 ng/ml TGF-β: CFs exhibit co-localization of αSMA staining with actin stress fibers (resulting in yellow signal) denoting differentiation into myofibroblasts (white arrows). Representative images were collected from a pool of images obtained from one cell donor, one independent experiment, minimum number of experimental replicates n = 4, technical replicates n = 3.

