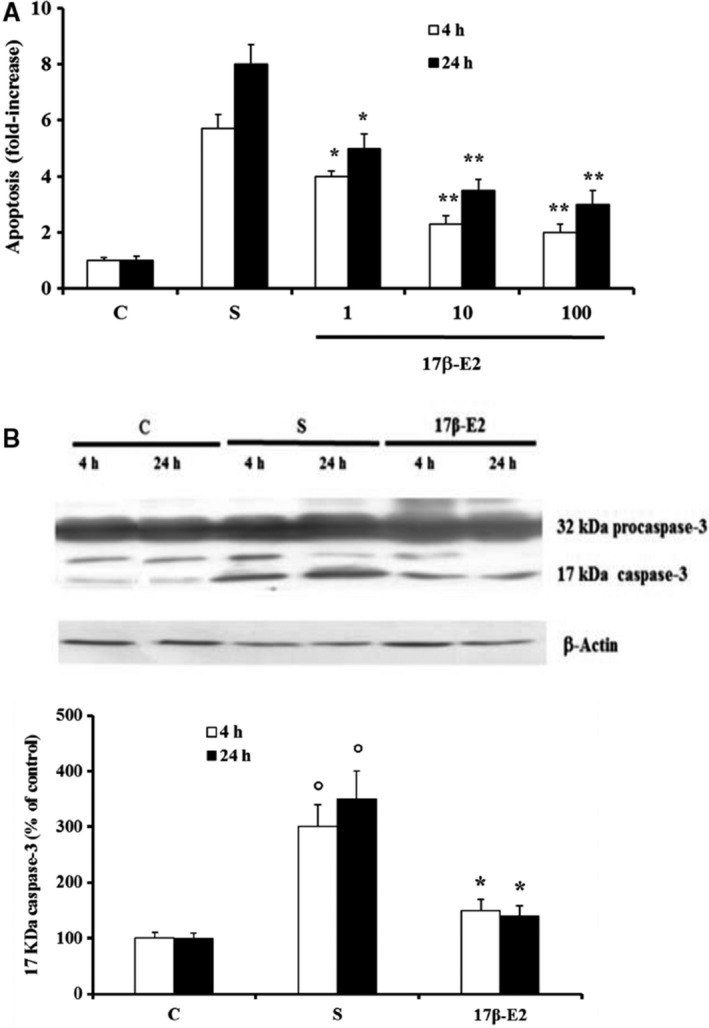
Figure 1.

Effect of various concentrations of 17β‐E2 on apoptosis and active 17 KDa caspase‐3 in MLO‐Y4 cells. Apoptosis (A) and active 17 KDa caspase‐3 (B) were measured in MLO‐Y4 cells cultured for 4 h and 24 h in complete medium (C, control) or in serum‐free medium (S, starved cells). S were treated or not with 17β‐E2 as reported in Materials and methods. Apoptosis data, relative to mono‐ and oligonucleosomes released into the cytoplasmic fraction from 104 cells treated with various nm concentrations of 17β‐E2, are expressed as fold‐increase over the respective C values and are the mean ± SEM of four experiments. Active 17 KDa caspase‐3 was measured in cells treated with 10 nm 17β‐E2 by Western blot analysis. Blots are representative of four experiments and the active 17 kDa caspase‐3 values are normalized with β‐Actin bands obtained by densitometric analysis and reported as the mean percentage ± SEM relative to the respective C values in the bottom. *P ≤ 0.05 and **P ≤ 0.005 compared to the respective S values; °P ≤ 0.005 compared to the respective C values.
