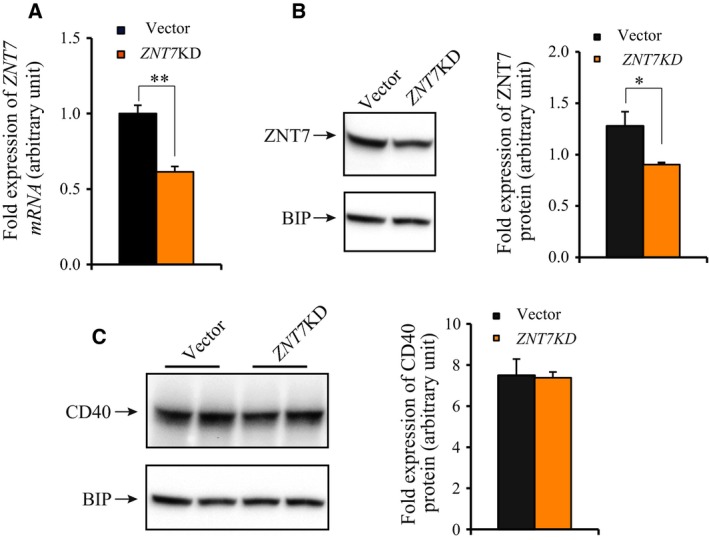
Figure 4.

Analysis of ZNT7 KD Raji B cell line. (A) mRNA expression of ZNT7 in ZNT7 KD Raji B cells. ZNT7 mRNA expression in ZNT7 KD and vector control Raji B cell lines was measured using a SYBR‐based quantitative RT‐PCR. ACTB was used as the internal control. Data were obtained from three independent experiments. Relative expression of ZNT7 mRNA in ZNT7 KD Raji B cells to the control was plotted. (B) ZNT7 protein expression in ZNT7 KD Raji B cells. ZNT7 was detected using an anti‐ZnT7 antibody 23. The expression of BIP was used as the loading control. (C) CD40 protein expression in ZNT7 KD Raji B cells. CD40 was detected using an anti‐CD40 antibody purchased from Santa Cruz Biotechnology. The expression of BIP was used as the loading control. Data were presented as mean ± SE (n = 3) of three independent experiments. Representative western blots are presented. *P < 0.05; **P < 0.01.
