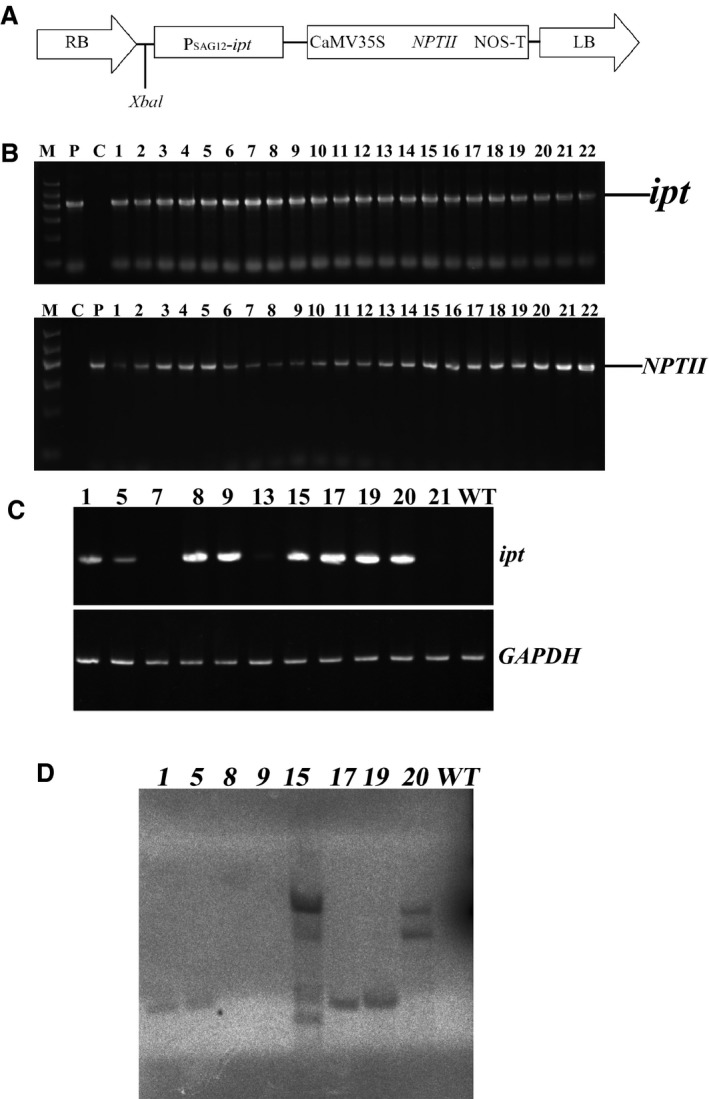
Figure 4.

The vector construct and molecular characterization of transgenic ramie plants. (A) Schematic drawings of the T‐DNA region in the pSG529 plasmid vector. RB, T‐DNA right border; PSAG 12 ‐ipt, the cytokinin biosynthesis gene ipt, derived from Agrobacterium tumefaciens, under the control of the SAG12 promoter from Arabidopsis; CaMV35S, cauliflower mosaic virus; NPTII, neomycin phosphotransferase II gene; NosT, nopaline synthase terminator; LB, T‐DNA left border. Xbal was the restriction enzyme site. (B) PCR analysis of the transgenic plants using primers specific to the ipt and NPTII genes. M, molecular size marker [the first lane is the DNA marker (TIANGEN Biotech Co. Ltd., Beijing, China)]. The fragment lengths of the DNA marker were 100 bp, 300 bp, 500 bp, 700 bp, 900 bp, and 1200 bp. P, positive control (plasmid DNA); C, control (untransformed plant). Lanes 1–22 were transgenic lines 1–22, respectively. Arrows point to the expected size bands. (C) Total RNA was isolated from WT and transgenic lines 1, 5, 7, 8, 9, 13, 15, 17, 19, 20, and 21. RT‐PCR was performed with ipt‐specific or GAPDH‐specific primers. The GAPDH gene was used as an internal control. (D) In the Southern blot analysis of the transgenic plants, the number of bands reflects the number of transgene insertions. Lane 9 was a negative control. Lanes 1–8 are transgenic lines 1, 5, 8, 9, 15, 17, 19, and 20, respectively.
