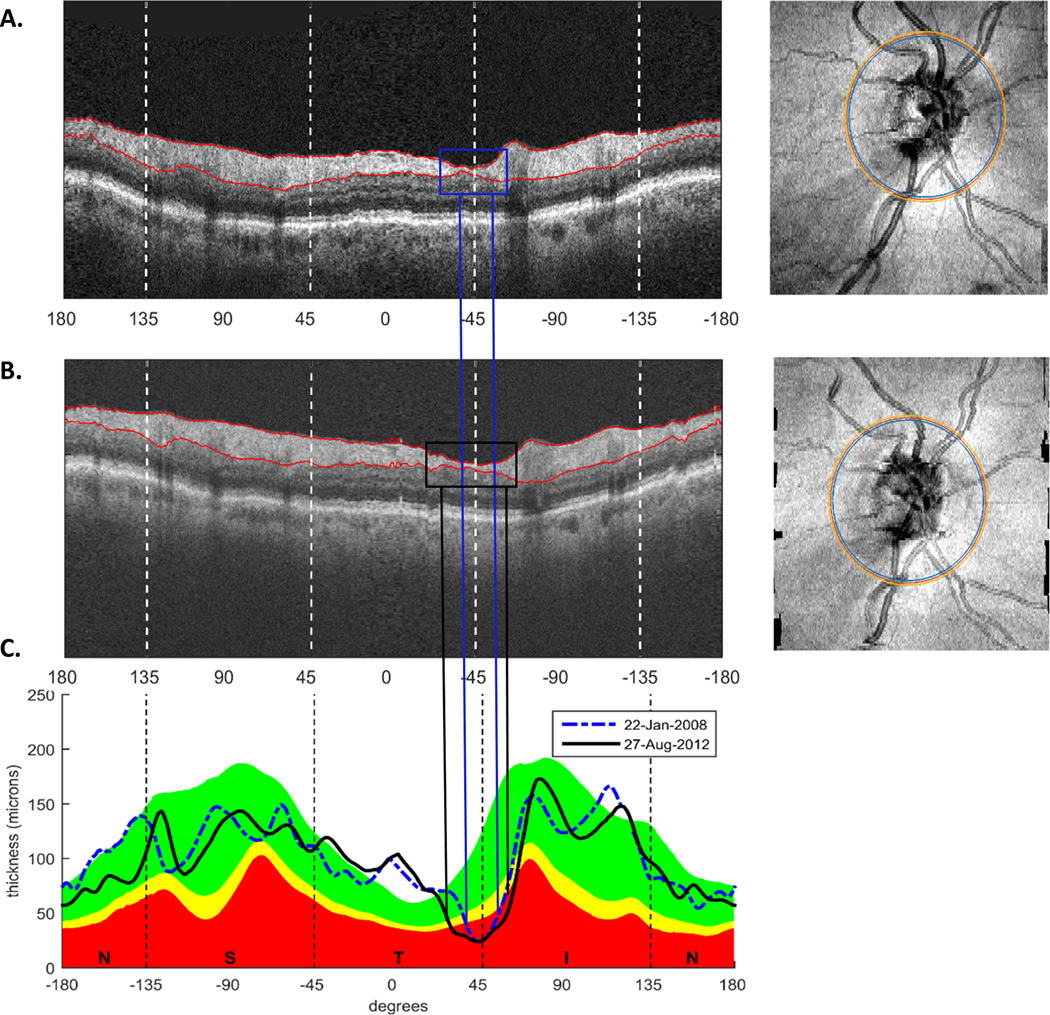
Figure 1.
A,B. Circumpapillary images (left panels) derived from the OCT cube scans at baseline (A) and final visit (B) after the en-face images (right panels in A and B) were aligned for one example eye. C. cpRNFL thickness profiles for the same example eye on the baseline (blue) and final (black) visits.

