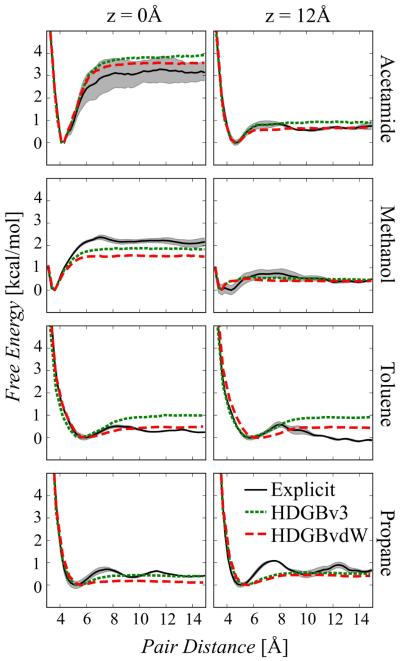
Figure 5.
Free energy profiles for intra-membrane pair association for acetamide, methanol, toluene and propane at z positions of 0 and 12 Å with HDGBv3 and HDGBvdW in comparison with explicit membrane simulations. The shaded areas are representing statistical uncertainties in the explicit membrane profiles.

