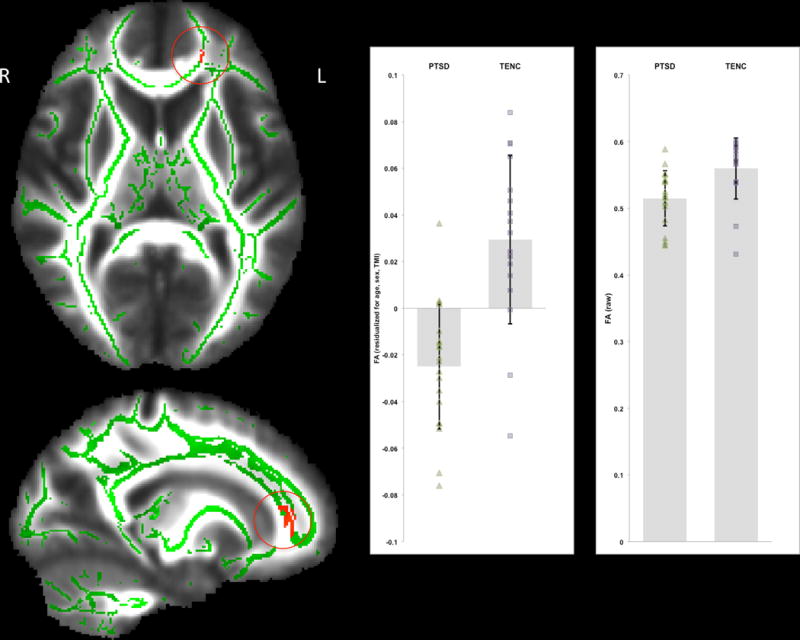
Figure 1.

Results of tract-based spatial statistics (TBSS) using a whole-brain analysis with TFCE and FWE correction at p < 0.05. There was one cluster with significantly lower FA values in PTSD compared to TENC (PTSD < TENC). This left frontal cluster involved fibers from the left anterior corona radiata/anterior thalamic radiation/forceps minor/uncinate fasciculus/inferior fronto-occipital fasciculus/cingulate gyrus. The significant cluster is shown in red, superimposed on the mean_FA_skeleton (in green) and overlaid on the mean_FA image in the MNI standard space. FA values residualized for age, sex, and TMI (at left) as well as raw FA values (at right) are displayed for each group.
