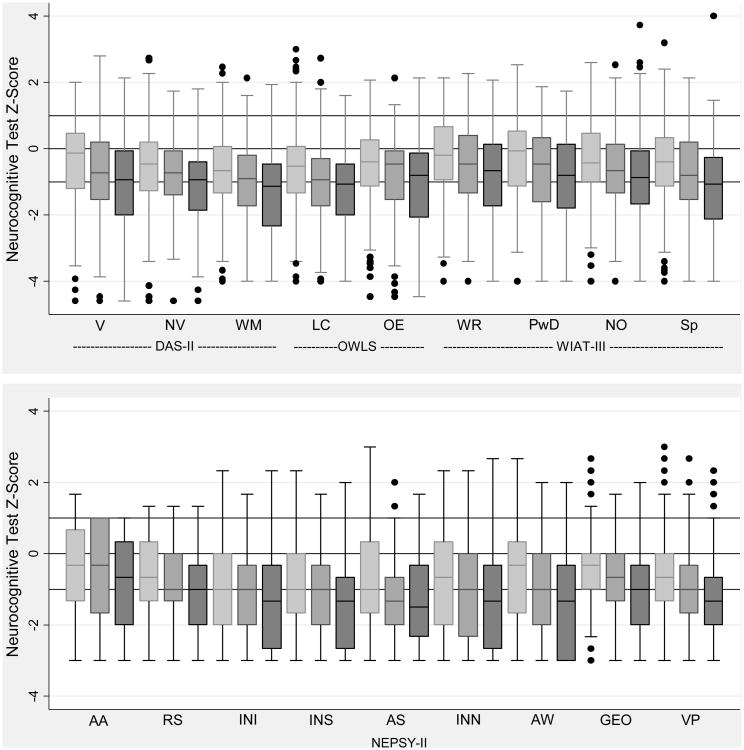
Figure 1.
1. Box-and-whisker plots of each neurocognitive subtest by SNAP-II. All subtest Z-scores are adjusted to population norms. Key: light gray is < 25, medium gray is ≥ 25, < 30, dark gray is ≥ 30. The central line in the box indicates the median (50th centile), while the top of the box indicates the 75th centile and the bottom of the box indicates the 25th centile. V=Verbal, NV=Nonverbal reasoning, WM=Working memory, LC=Listening comprehension, OE=Oral expression, WR=Word reading, PwD=Pseudoword decoding, NO=Numerical operations, Sp=Spelling, AA=Auditory attention, RS= Auditory response set, INI= Inhibition inhibition, INS= Inhibition switching, AS= Animal sorting, INN= Inhibition naming, AW=Arrows, GEO=Geometric puzzles, VP=Visuomotor precision.
1Odds ratios whose lower bound is to the right of the 1.0 vertical line are statistically significant at the p < 0.05 level.

