
Fig. 5.
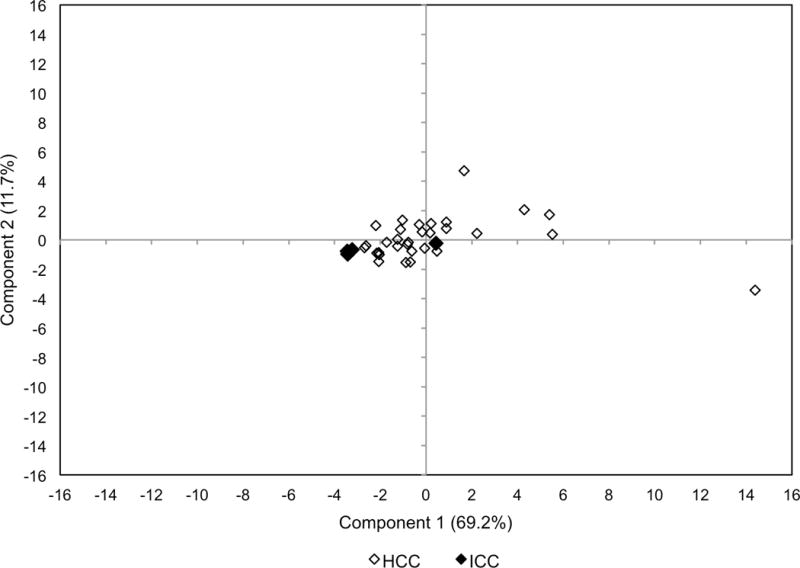
PCA score plot including both HCC and ICC samples. Based on principal components 1 and 2, there is tight clustering of 3 out of 4 ICC tumors (overlapping black dots) separable from HCC tumors. The HCC tumors are more broadly distributed. The ICC tumor near the origin (0,0) was not distinguishable from HCC tumors based on principal components. This was the only ICC tumor that demonstrated iso-intense uptake on [18F]-fluorocholine PET/CT.