
Figure 2. Mitochondrial cristae density is elevated in endurance‐trained athletes.
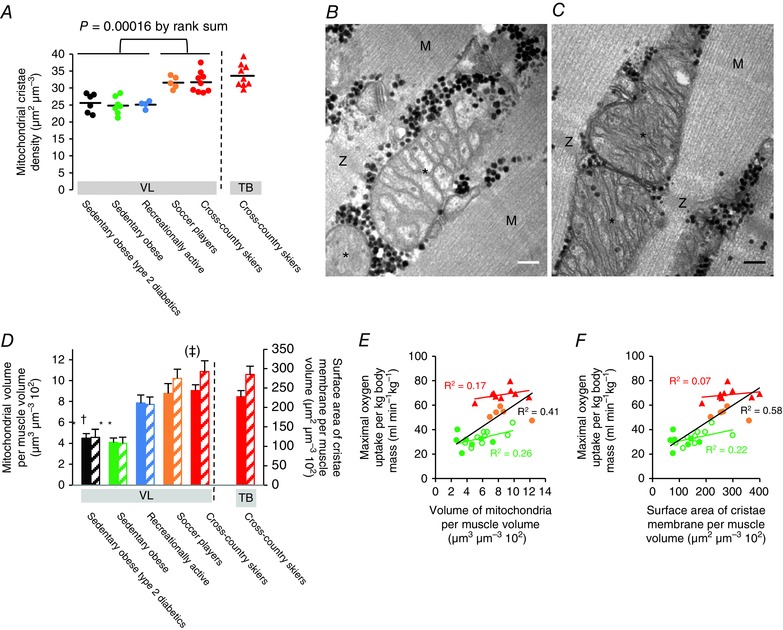
A, cross‐country skiers and soccer players have a higher mitochondrial cristae density than recreationally active and sedentary obese individuals (sedentary obese type 2 diabetics, n = 6; sedentary obese, n = 7; recreationally active, n = 4; soccer players, n = 5; and cross‐country skiers, n = 9). Horizontal lines represent the mean of all individuals in each population. VL, musculus vastus lateralis. TB, musculus triceps brachii. B and C, transmission electron micrographs representing mitochondrial profiles with a low and high cristae density from an obese sedentary man (B) and a cross‐country skier (C), respectively. Asterisks indicate the mitochondrial profile. M, M‐band of the adjacent sarcomeres. Z, Z‐disk of the adjacent sarcomeres. Black dots are glycogen particles. Scale bar = 100 nm. D, endurance‐trained athletes have a higher mean mitochondrial volume per fibre volume (filled bars, left axis) and mean surface area of cristae membrane per volume of fibre (hatched bars, right axis) than sedentary obese individuals. *Different from the other groups (P < 0.05); †Different from soccer players and cross‐country skiers (P < 0.05); (‡)Different from recreationally active (P = 0.07). Values are the mean and horizontal bars represent the SD. E and F, surface area of cristae membrane per fibre volume is a better predictor of maximal oxygen uptake than mitochondrial volume per fibre volume. Colour coding as in (A). Open green symbols represent post 10 weeks of aerobic training (n = 9). Lines represent best fit (E, r 2 = 0.17, P = 0.28; r 2 = 0.26, P = 0.04; r 2 = 0.41, P < 0.001; F, r 2 = 0.07, P = 0.49; r 2 = 0.22, P = 0.07; r 2 = 0.58, P < 0.001).