
Figure 4. Type 1 fibres have a higher mitochondrial cristae density than type 2 fibres in endurance‐trained athletes.
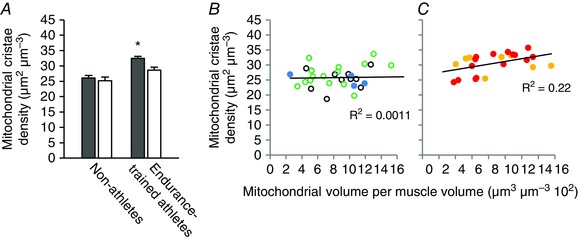
A, mitochondria cristae density in type 1 fibres (grey bars) and type 2 fibres (white bars) of non‐athletes (n = 20 and 10 subjects for type 1 and 2 fibres, respectively) and endurance‐trained athletes (n = 12 and 11 subjects for type 1 and 2 fibres, respectively). Values are the mean and horizontal bars represent SD. There was a significant interaction between fibre types and group of individuals (P = 0.024). *Significantly different from type 2 fibres (P < 0.001). B and C, mitochondrial cristae density plotted against mitochondrial volume fraction of non‐athletes (b) and endurance‐trained athletes (C). Colour coding: open black circles, sedentary obese type 2 diabetic patients post 10 weeks of training; open green circles, sedentary obese post 10 weeks of training; blue circles, recreationally active; yellow circles, soccer players; red circles, cross‐country skiers. Lines represent linear fit (B, r 2 = 0.0011, P = 0.86; C, r 2 = 0.22, P = 0.024).