
Figure 1. A summary of the correlates of the gains in in the HERITAGE Family Study.
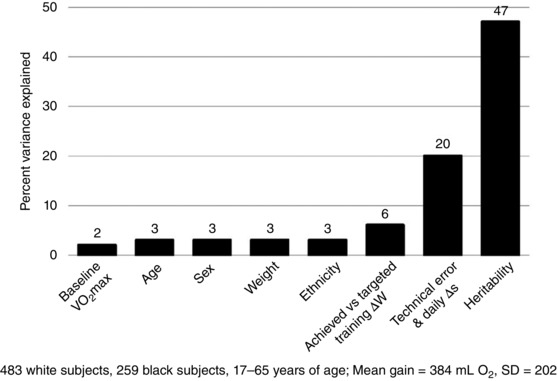
The contributions of various correlates in terms of percentage variance accounted for in response are shown. Details are provided in the text.
Official websites use .gov
A
.gov website belongs to an official
government organization in the United States.
Secure .gov websites use HTTPS
A lock (
) or https:// means you've safely
connected to the .gov website. Share sensitive
information only on official, secure websites.
The contributions of various correlates in terms of percentage variance accounted for in response are shown. Details are provided in the text.