
Figure 2. Maximal CS activity in resting skeletal muscle biopsies in response to six sessions of MICT (white bars) and HIIT (black bars).
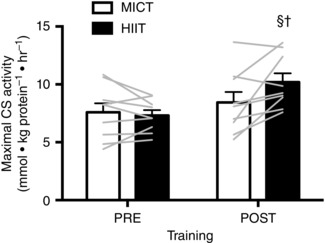
The bars represent the mean data pre‐ and post‐training, whereas individual data are displayed as grey lines. Symbols indicate a significant difference from the within‐group, pre‐training mean (§) and a significant difference between groups at the post‐training mean (†). Error bars represent the SEM (n = 9 subjects).