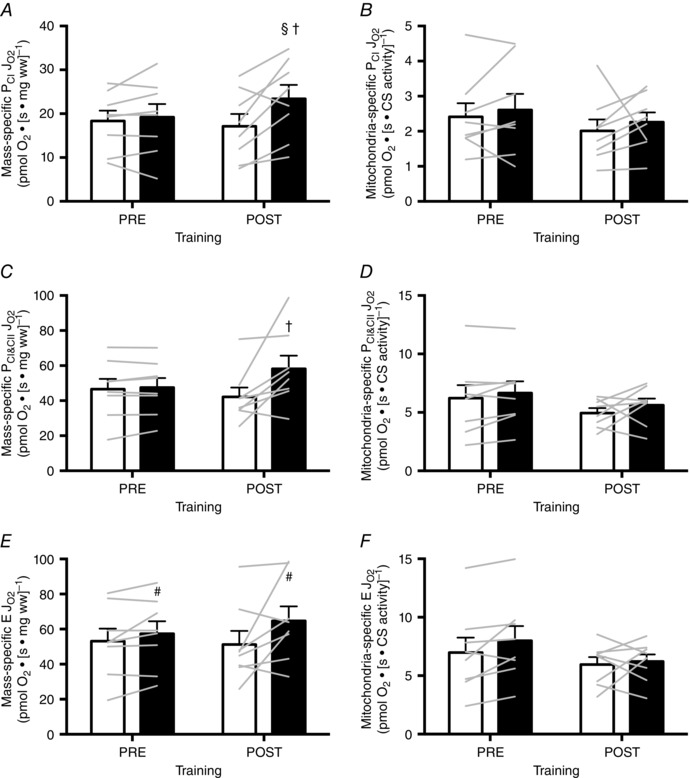
Figure 3. Mass‐specific and mitochondria‐specific J O2 in resting permeabilized muscle fibres in response to six sessions of MICT (white bars) and HIIT (black bars).

Bars in (A), (C) and (E) show the mean values for mass‐specific PCI, PCI&CII and E respectively, whereas the bars in (B), (D) and (F) show the mean values for mitochondria‐specific PCI, PCI&CII and E, respectively. Individual subjects are shown as grey lines. Symbols indicate a significant effect of group (#), a significant difference from the within‐group, pre‐training mean (§) and a significant difference between groups at the post‐training mean (†). Error bars represent the SEM (n = 8 subjects).
