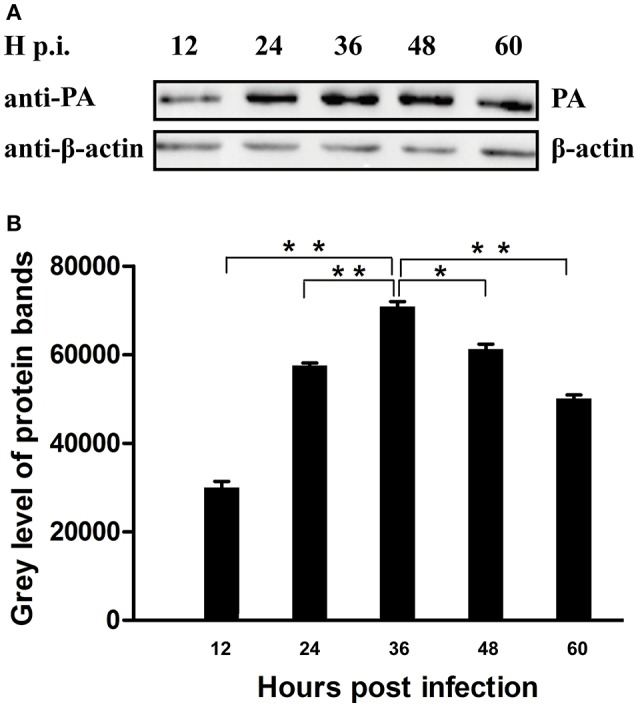
Figure 1.

Determination of the peak of PA expression in the process of IAV infection. (A) Cell lysate from CK10-infected A549 cells at indicated time points were subjected to Western blot using anti-PA antibody and anti-β-actin antibody. Three independent experiments were perfomed and this is the representative data. (B) The Image J software was used to determine the expression level of the PA protein. Values shown are the gray level of the PA protein bands of western blot experiments ± SD of the results from three independent experiments. *p < 0.05 and **p < 0.01, when compared to the indicated group.
