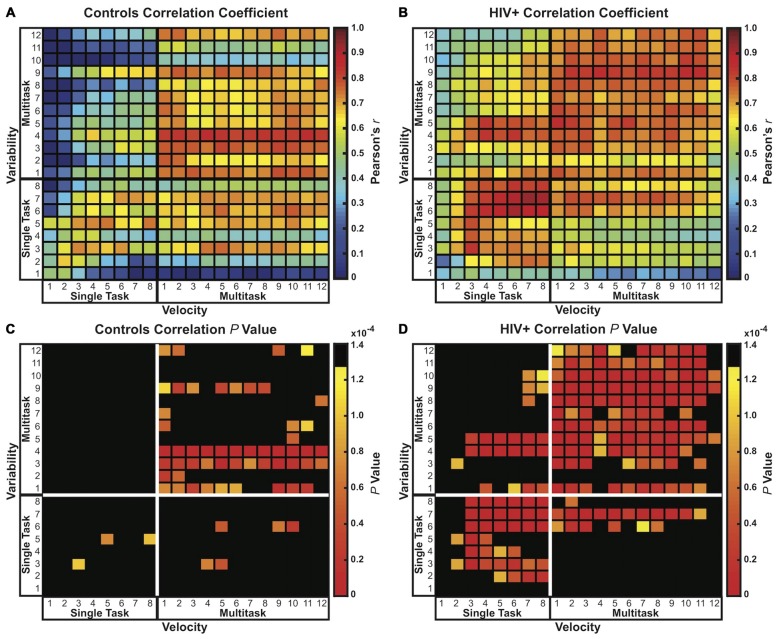
Figure 5.
Correlation coefficient matrices (20 × 20) comparing velocity and variability. Pearson’s r and p value matrices are plotted for controls (A,C) and HIV+ participants (B,D), respectively. Both groups showed positive correlations between velocity and variability, with strongest Pearson’s r and p values shown in red. HIV+ participants demonstrated a notably strong positive link between velocity and variability compared to controls. The critical p value was adjusted using the Bonferroni correction for multiple comparisons resulting in a corrected threshold of p < 0.000125 (0.05/400).

