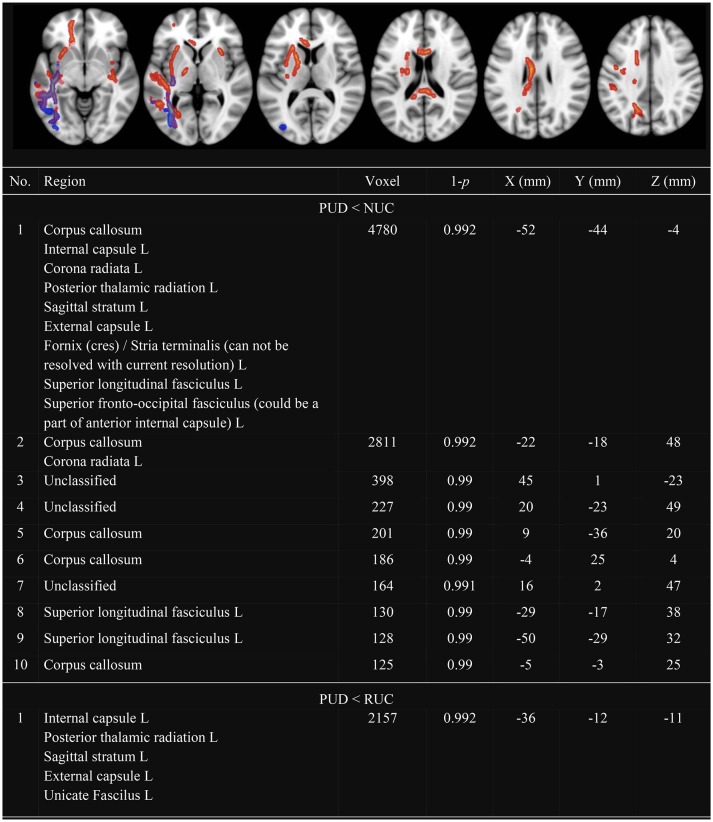
Figure 2.
Clusters with decreased MD in PUD compared to NUC and RUC. Only Clusters with a size more than 100 voxel are presented. MD, Mean Diffusivity; NUC, Non-using controls; RUC, Recreational using controls; PUD, Poly-drug use disordered patients; PUD < NUC, Decreased MD in PUD in comparison to NUC (red-yellow); PUD < RUC, Decreased MD in PUD in comparison to RUC (blue-green); No., Number; Region, Included regions according to JHU ICBM-DTI-81 White-Matter Labels; R, Right; L, Left; Voxel, Number of voxel per cluster; 1-p = Statistical peak-value for each cluster; X –Y– Z (mm) = Peak-coordinates for each cluster. Significantly different clusters have been thickened with the FMRIB Software Library option “tbss_fill.”

