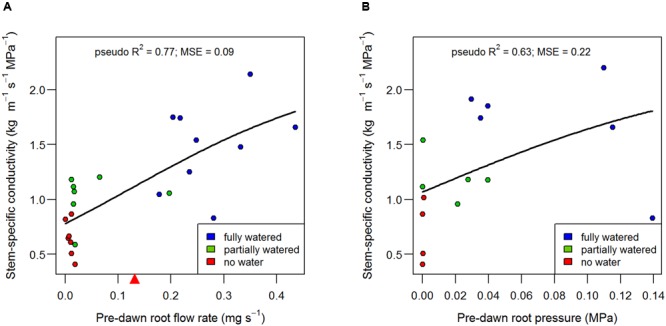
FIGURE 4.

Alignment of root flow (A) and root pressure (B) with the recovery of stem-specific conductivity measured in B73 internodes. The point where root flow rate equals the rate of transpiration in the fully watered treatments (the point where xylem water potential approaches zero) is denoted by a red triangle on the x axis in (A), and should be interpreted as the minimum root flow rate at which neutral xylem tension could be expected. Data points represent individual plants and have been fit with logistic models.
