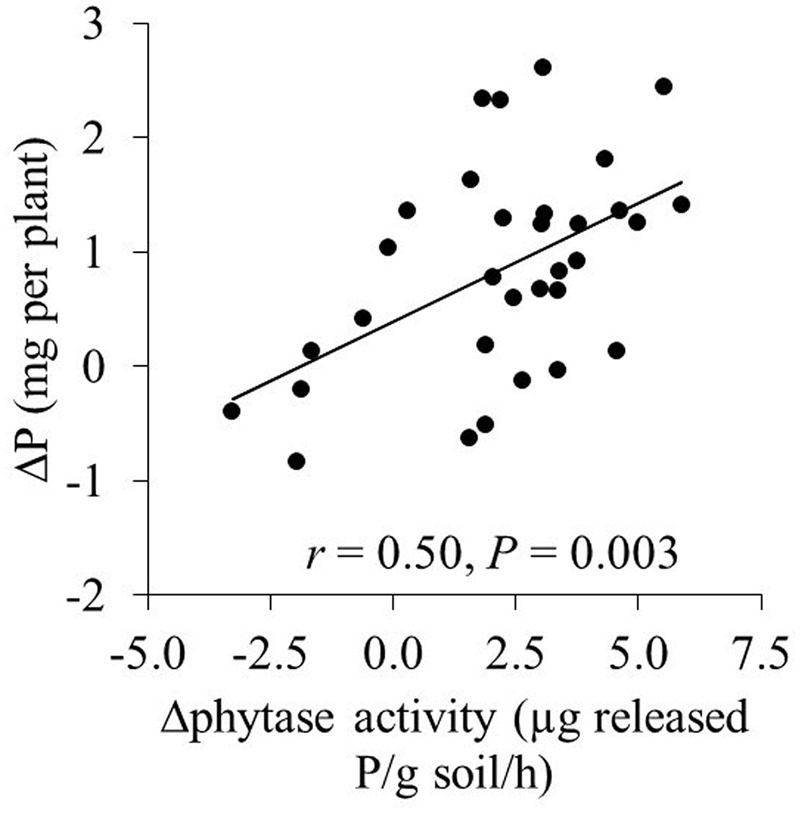
FIGURE 3.

The relation between the increase (Δphytase) in phytase activity (compared to the addition of 20 mg P kg-1) and the increase in P uptake (ΔP) in the mycorrhizal treatments. Each symbol represents one cultivar and the means of four replicates.
