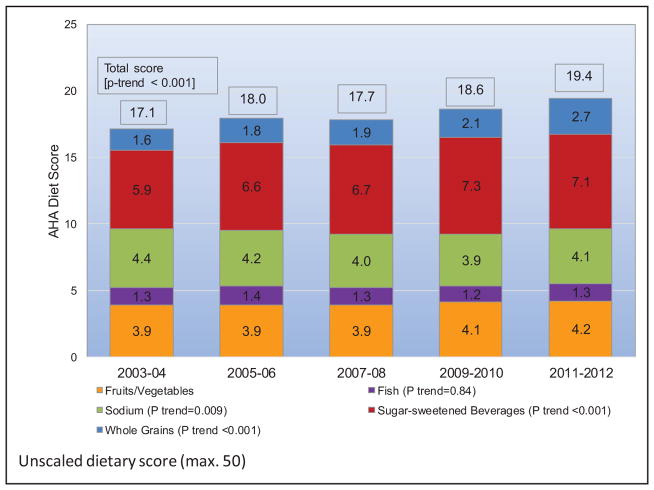
Chart 5-4. Trends in AHA-defined healthy diet score components for children (5–19 years old) by survey year: NHANES 2003 to 2004, 2005 to 2006, 2007 to 2008, 2009 to 2010, and 2011 to 2012.
Unscaled dietary score (maximum=50). Mean healthy diet score components based on the alternative scoring ranges described in Table 5-1.
AHA indicates American Heart Association; max., maximum; and NHANES, National Health and Nutrition Examination Survey.
Sources: My Life Check: Life’s Simple 71; Lloyd-Jones et al2; Rehm et al.3

