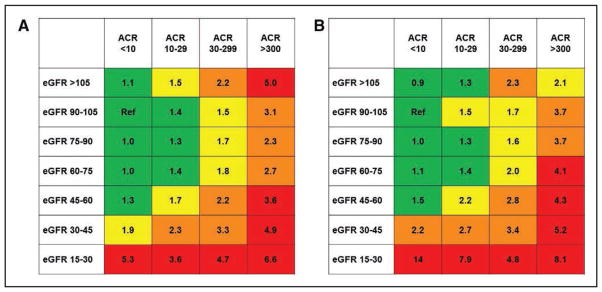
Chart 12-6. Adjusted relative risk of (A) all-cause mortality and (B) cardiovascular mortality in the general population categorized by KDIGO 2012 categories of chronic kidney disease.
Data are derived from categorical meta-analysis of population cohorts. Pooled relative risks are expressed relative to the reference (Ref) cell. Colors represent the ranking of the adjusted relative risks (green=low risk; yellow=moderate risk; orange=high risk; red=very high risk).
ACR indicates urine albumin-to-creatinine ratio; eGFR, estimated glomerular filtration rate; and KDIGO, Kidney Disease: Improving Global Outcomes.
Modified from Levey et al80 with permission from International Society of Nephrology. Copyright © 2011, International Society of Nephrology.

