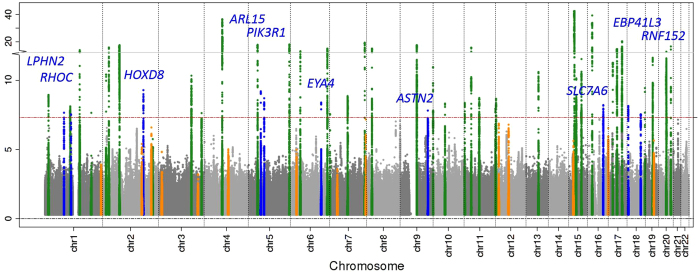
Figure 1. Manhattan Plot of the results of the 1000 Genome meta-analysis of eGFRcrea.
Shown are the (−log10) p-values by genomic position (GRCh build 37). Highlighted are the 10 novel loci identified with genome-wide significance (blue, annotated by nearest gene), the 39 previously published2,3,4,5,6,7 and confirmed (genome-wide significant) loci (green) and the 14 previously published loci that were not genome-wide significant in this analysis (orange).

