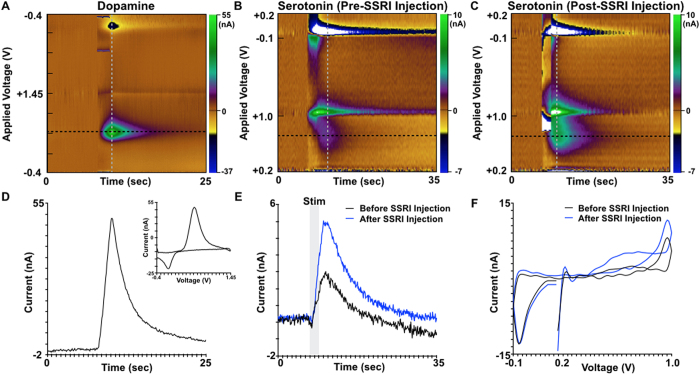
Figure 4. Recording of multiple neurotransmitters at two different anatomical targets in a rodent model of medial forebrain bundle deep brain stimulation.
(A) Pseudocolor plot showing the detection of stimulation-evoked dopamine in the rodent striatum in response to medial forebrain bundle (MFB) stimulation. Dopamine measurement was performed using fast scan cyclic voltammetry (FSCV) and a standard pyramidal waveform from a −0.4 V holding potential to a +1.45 V switching potential. (B) Pseudocolor plot showing the simultaneous detection of serotonin in the substantia nigra pars reticulata (SNr) using FSCV with a standard N-shaped waveform from +0.2 V to +1.0 V, back down to −0.1 V, and up to +0.2 V. (C) Pseudocolor plot showing an increase in stimulation-evoked serotonin release in the SNr following systemic injection of the selective serotonin reuptake inhibitor (SSRI) fluoxetine. (D) Time-series plot showing the current recorded at the dopamine oxidation peak (black dashed line in pseudocolor plot). The inset panel shows the background subtracted voltammogram recorded at the peak dopamine oxidation current (grey dashed line in the pseudocolor plot). (E) Detection of evoked serotonin in the SNr before and after SSRI administration. Time-series data was extracted from the FSCV data at the black dashed line in panels (B) and (C). (F) Background subtracted cyclic voltammograms for serotonin before and after SSRI administration and extracted at the grey dashed line in panels (B) and (C) respectively.

