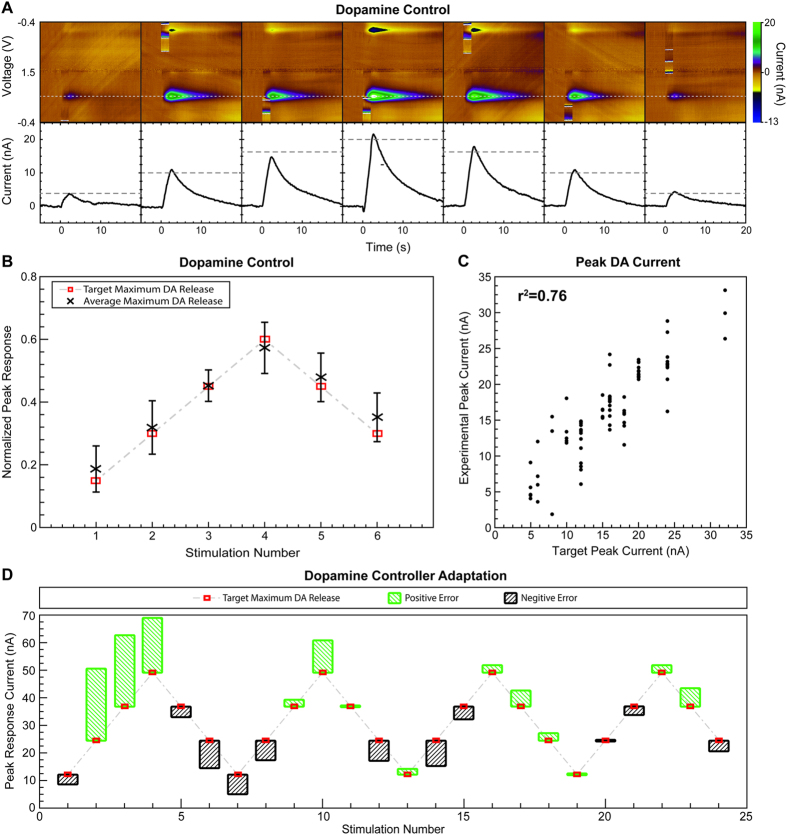
Figure 5. Closed-loop control of phasic dopamine release in a rodent model of medial forebrain bundle deep brain stimulation.
(A) Pseudocolor plots (top) and dopamine oxidation current (bottom) showing control of stimulation-evoked dopamine response amplitude over seven dopamine target responses in one rodent model of medial forebrain bundle (MFB) deep brain stimulation (DBS). Pseudocolor plots (top) and time series measurements (bottom) show the dopamine oxidation current measured. A dashed grey line shows the target peak dopamine oxidation currents. Solid black lines show the kinetics of stimulation-evoked dopamine. (B) Dopamine release targets (red squares) and average experimentally evoked dopamine release (black x) evoked with stimulation parameters predicted by the artificial neural network (ANN) controller. Error bars represent standard deviation. Results from five rodents are normalized to the maximum response predicted by the ANN controller. (C) Regression analysis between the target dopamine responses and the peak dopamine responses evoked with parameters predicted by the ANN controller. Pearson’s correlation coefficient was r2 = 0.76. (D) Adaptation of the ANN controller when initiated with an incorrect calibration (n = 1). The error in the experimental response (green or black boxes) with respect to the target maximum dopamine release (red squares) decreased with each stimulation event as the ANN controller adapted.

