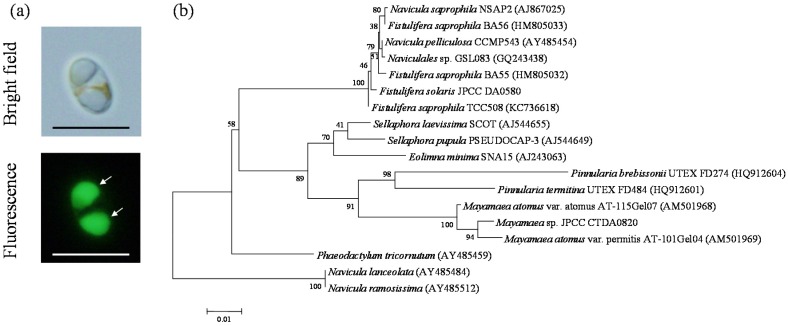
Figure 1.
Microscopic images (a) and phylogenetic position (b) of JPCC CTDA0820. In the fluorescent microscopic images, oil bodies stained with BODIPY505/515 are indicated by arrows. Phylogenetic analysis was performed based on the 18S rDNA gene sequence data. Bootstrap values greater than 50 are shown on the nodes that were recovered in the maximum likelihood analysis.

