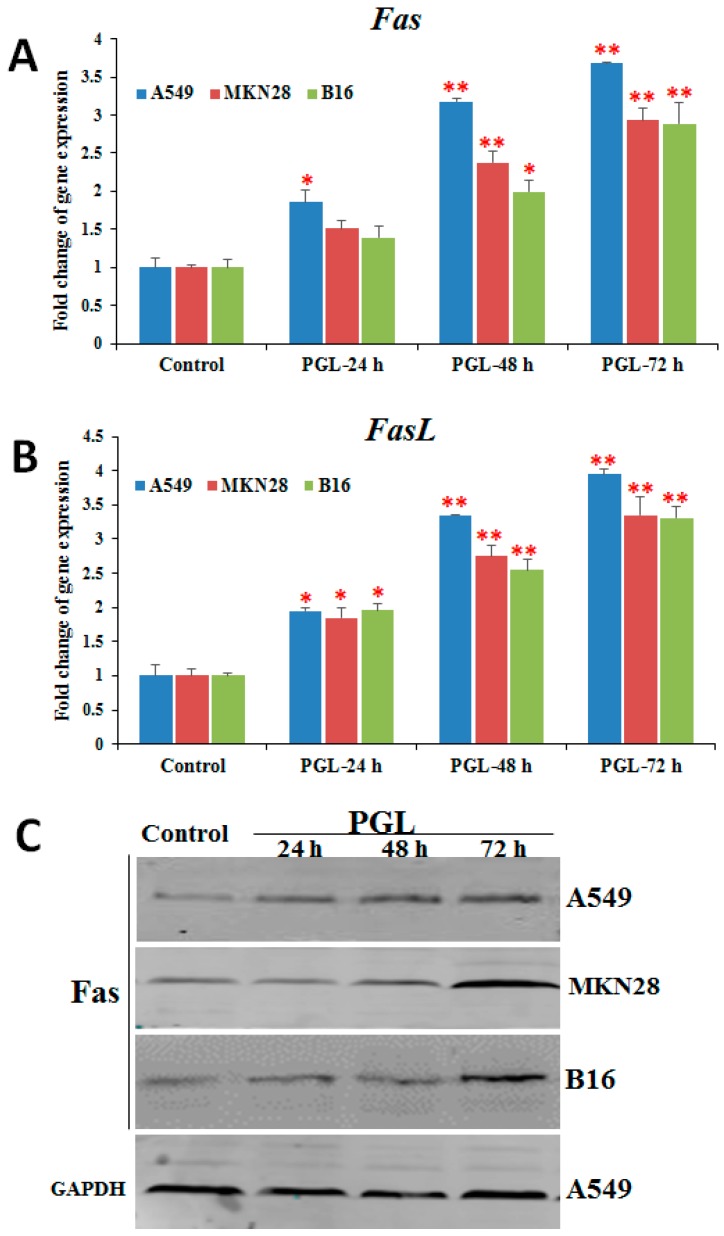
Figure 5.
Effects of PGL on the expression of Fas and FasL in three cancer cell lines. (A) The mRNA expression of Fas after PGL treatment in three cancer cell lines. (B) The mRNA expression of FasL after PGL treatment in three cancer cell lines. (C) Fas protein levels in the three PGL-treated cancer cells, as assessed by western blotting. The three cancer cell lines were treated with 0 or 50 μg/mL PGL for 24, 48, and 72 h, and gene expression was examined by RT-qPCR. The columns show the mean ± SD of five samples for each group. * p < 0.05 and ** p < 0.01 indicate significant differences between the control and PGL-treated groups. The data are representative of five independent experiments.

