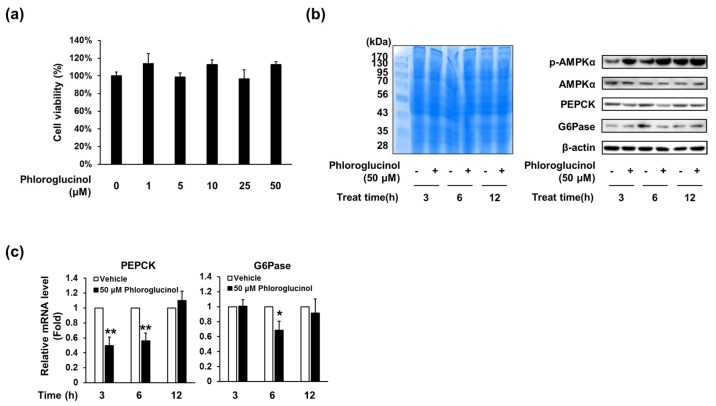
Figure 3.
Effects of phloroglucinol on PEPCK and G6Pase gene expression levels in HepG2 cells. (a) HepG2 cells were treated with the indicated concentrations of phloroglucinol for 24 h and cell viability was determined by CCK-8 assay. HepG2 cells were treated with 50 μM phloroglucinol for the indicated times; (b) Protein bands were detected by Coomassie blue staining (left) and phospho-AMPKα (Thr-172), AMPKα, PEPCK and G6Pase protein levels were detected by Western blotting (right) and (c) PEPCK and G6Pase mRNA expression levels were analyzed by RT-qPCR. Data are presented as means ± standard deviation (SD), three independent experiments were performed. (* p < 0.05 and ** p < 0.005 vs. vehicle; Student’s t-test)

