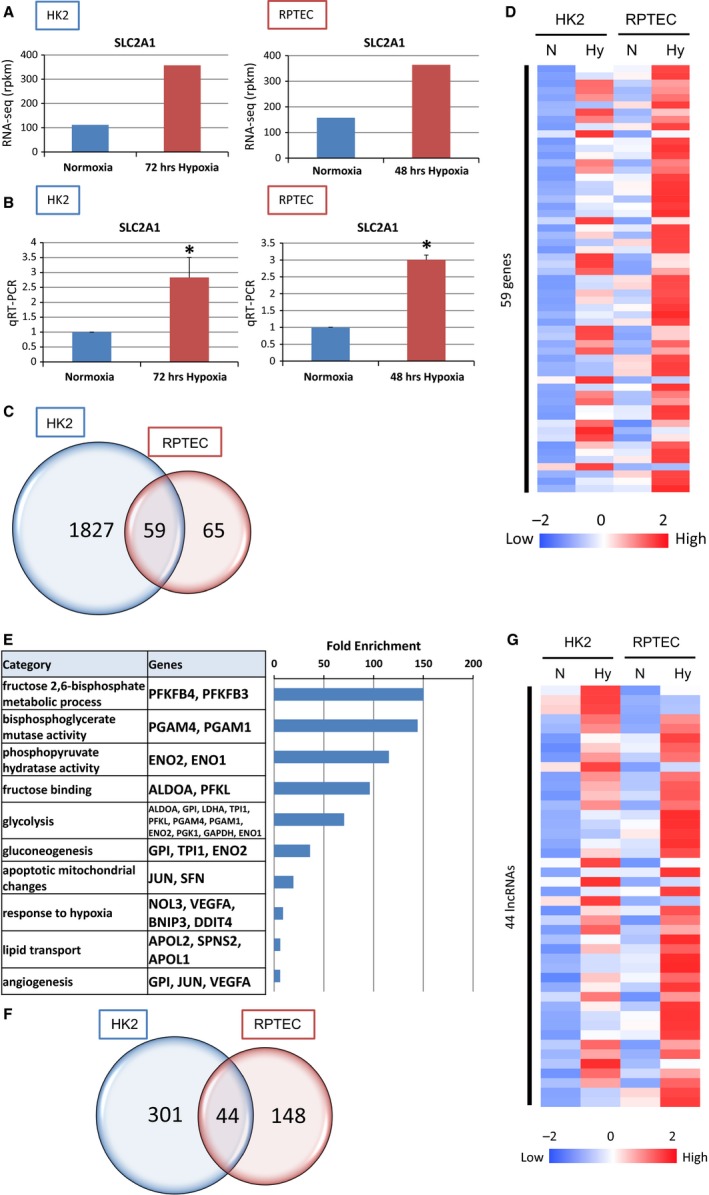
Figure 1.

The results of RNA‐seq identified hypoxia‐inducible genes and lncRNAs under hypoxia in tubular cell lines. (A) RNA‐seq data in normoxia and hypoxia on the SLC2A1 loci in HK2 and RPTEC. HK2 were exposed to hypoxia for 72 h and RPTEC for 48 h. (B) Quantitative RT‐PCR of expression of SLC2A1 to validate RNA‐seq data in HK2 and RPTEC. (C) Venn diagram of hypoxia‐inducible genes in HK2 and RPTEC from RNA‐seq data. Thousand eight hundred and twenty‐seven genes were up‐regulated under hypoxia only in HK2, 65 genes only in RPTEC, and 59 genes in both HK2 and RPTEC. (D) HK2 and RPTEC were stimulated by hypoxia. RNA‐seq data are summarized by heatmap. Fifty‐nine genes were up‐regulated in both HK2 and RPTEC. (E) Functional annotations for commonly up‐regulated genes and the representative gene symbols for each category are shown in the middle panels. The enrichment scores of each category from DAVID are shown in the bar graphs on the right panels. (F) Venn diagram of hypoxia‐inducible lncRNAs in HK2 and RPTEC from RNA‐seq data. The numbers indicate the HK2 and RPTEC common and unique up‐regulated lncRNAs under hypoxia. (G) RNA‐seq data are summarized by heatmap. Forty‐four lncRNAs were up‐regulated in both HK2 and RPTEC.
