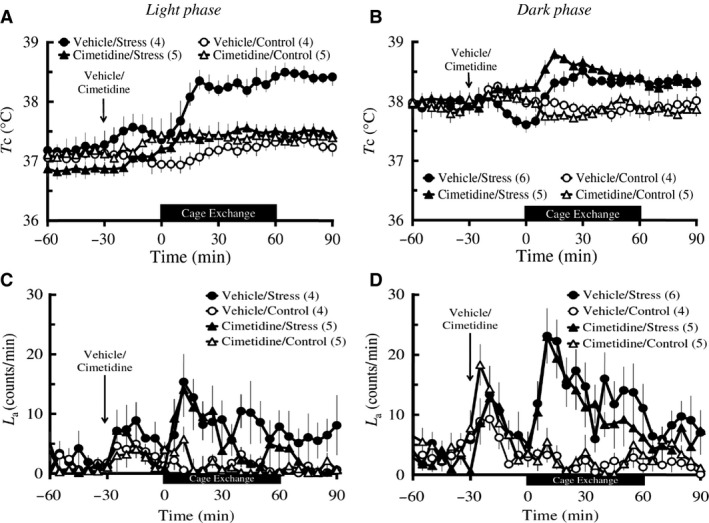
Figure 3.

Effects of cimetidine on the cage‐exchange stress‐induced changes in T c (A and B) and L a (C and D) in light and dark phases. Rats (n = 4–6 per group) were administered with either an IP injection of 100 mg/kg cimetidine (triangles) or its vehicle (circles) at time ‐30 min (arrows), either exposed to cage‐exchange stress (Stress: filled circles) or left undisturbed (Control: empty circles) at time zero for 60 min (black bar), then returned to their home cages in the light (A and C) and dark (B and D) phases. Each point represents mean ± S.E.M. The differences in both T c and L a among the groups were compared using two‐way repeated measures ANOVA followed by Bonferroni post hoc test. N in the parentheses = number of animals.
