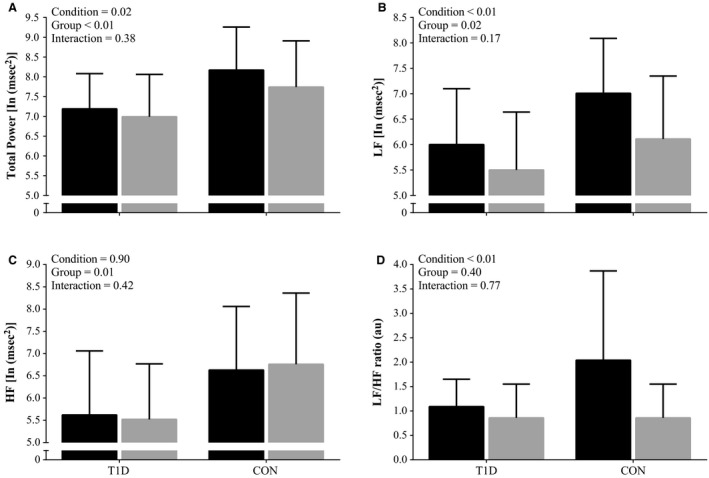
Figure 2.

Heart Rate Variability indices during baseline and paced breathing. During baseline (black bars) and paced breathing (gray bars), in controls (CON; n = 17) and people with Type 1 Diabetes (T1D; n = 23). (A) TP; Total Power. (B) LF; Low Frequency Power. (C) HF; High Frequency Power. (D) LF/HF ratio; Low Frequency Power to High Frequency Power ratio. Values are natural log transformed (except the LF/HF ratio) and are present as means ± SD.
