Figure 9.

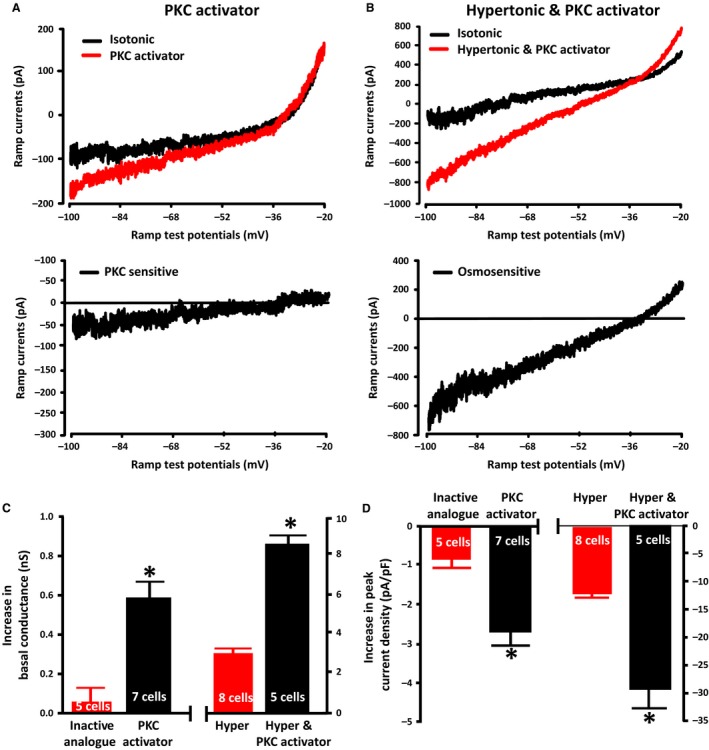
PKC activation increases TRPV1 currents in isotonic saline and enhances the osmotic activation of TRPV1 currents. (A) The upper panel shows the mean ramp current traces evoked before (black trace) and after (red trace) exposure to the PKC activator phorbol 12‐myristate 13‐acetate (PMA; 0.2 μmol/L) in isotonic saline. The lower trace shows the digital subtraction of the black and red traces, which therefore represents the PKC activated current. (B) The upper panels on the right show the mean ramp current traces evoked before (black trace) and after (red trace) exposure to hypertonic saline (325 mosmol kg−1) in the presence of the PKC activator phorbol 12‐myristate 13‐acetate (PMA; 0.2 μmol/L). The lower trace shows the digital subtraction of the black and red traces, which therefore represents the osmotically‐evoked current in the presence of PMA. (C) The bar graph on the left shows the mean increase in the membrane conductance of MNCs caused by the PKC activator and the bar graph on the right shows the effect of hypertonic saline (325 mosmol kg−1) in the presence of the PKC activator compared to the effect of hypertonic saline (325 mosmol kg−1) in the absence of the PKC activator (data from the previous experiment). (D) The bar graph on the left shows the mean membrane conductance of MNCs in the presence of the inactive analogue and the PKC activator and the bar graph on the right shows the effect of hypertonic saline (325 mosmol kg−1) in the presence of the PKC activator compared to the effect of hypertonic saline (325 mosmol kg−1) in the absence of the PKC activator (data from the previous experiment). Data are expressed as mean ± SEM (P < 0.05 is indicated by *).
