
Fig. 1. Mitochondrial dysfunction is associated with progressive RGC damage in glaucoma.
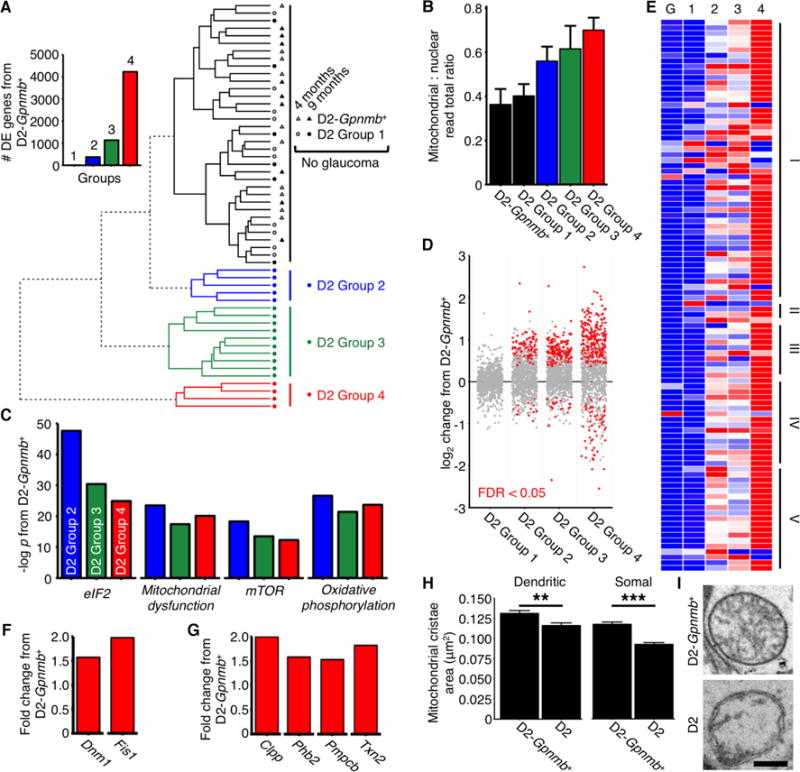
(A) RGC samples were divided into molecularly distinct groups by HC of RNA-seq determined gene expression. Control (D2-Gpnmb+) and young samples were molecularly similar (Spearman’s rho; n = 63 samples). Circles = samples from D2 RGCs, triangles = samples from D2-Gpnmb+ RGCS. Inset: number of DE genes (q < 0.05) between D2-Gpnmb+ and each group. D2 Group 1 and D2-Gpnmb+ represent no glaucoma at a molecular/transcriptomic level. (B) Mitochondrial: nuclear read total ratio increased with increasing HC distance from controls. Colors match key in A. (C) Top significantly enriched pathways between clusters and control based on IPA analysis (there are no differentially expressed pathways in D2 Group 1) (see also Table S3). (D) Transcript expression primarily increased for nuclear encoded mitochondrial proteins with increasing HC distance from controls. Dots represent individual genes, grey = not differentially expressed, red = differentially expressed at q < 0.05. Genes taken from mouse MitoCarta2.0 (28) (E) OXPHOS genes were differentially expressed across all groups. Red = highest expression, blue = lowest expression, I–V = mitochondrial complexes I–V (tabulated in Table S1), G = D2-Gpnmb+, 1–4 = D2 Groups 1–4. (F) RNA-seq identified increased mitochondrial fission gene transcripts early in glaucoma and (G) suggests an early mitochondrial unfolded protein response compared to controls. Data shown is for D2 Group 4. (H and I) Mitochondria of D2 mice have decreased cristae volume (and cristae : total volume ratio, not shown) in RGC somal and dendritic mitochondria (there was no significant difference in total mitochondrial size/volume) (n > 400 mitochondria from 6 retinas/group). Scale bar = 350 nm. All data is at 9 mo unless otherwise stated. ** = P < 0.01, * = P < 0.001 (Student’s t test). See also Table 1, Table 2.