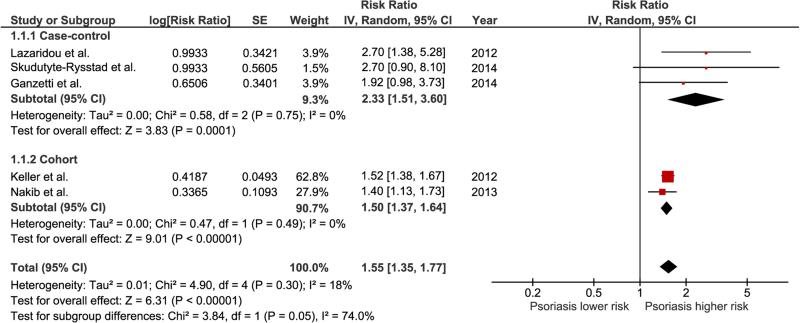
Figure 2.
Forest plot of this meta-analysis. The sizes of the boxes used for each study represent the weight of that study used for calculation of the pooled effect. The diamonds at the bottom of this forest plot represent the pooled risk ratios with 95 % CIs (the center of the diamond represents the pooled risk ratio, and the lateral lips of diamond represent the associated 95 % CI)

