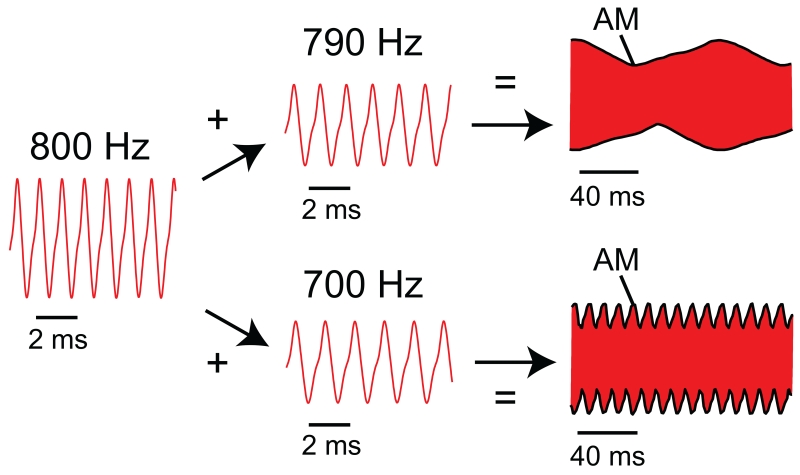
Fig. 2.
Interactions of EODs to produce beats. Red traces are the head-tail voltage during the EOD. Beat frequency is determined by the EOD frequencies of the two interacting EODs. Here an 800 Hz EOD was combined with a 790 Hz EOD to create a 10 Hz beat (top). Then the same 800 Hz EOD was combined with a 700 Hz EOD to create a 100 Hz beat (bottom). The AM (amplitude modulation) is indicated with thick black lines on the beats. Note the differing timescales for the EODs and the beats. Also note that neither the EOD waveform nor the beat waveform is precisely sinusoidal.

