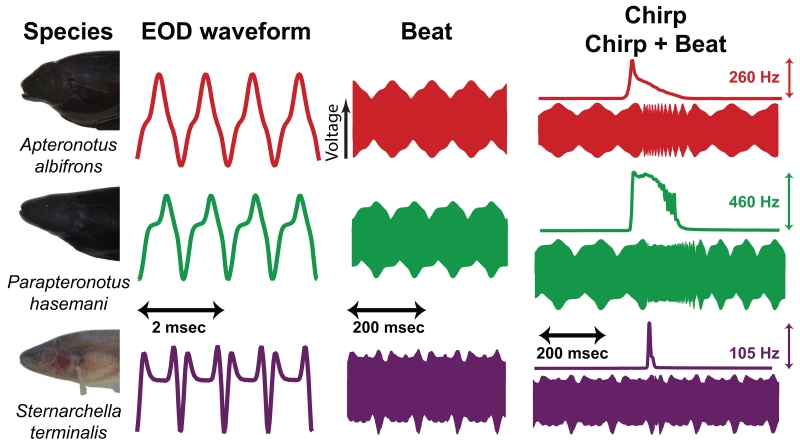
Fig. 3.
EOD waveform and chirp structure vary substantially across species. We present a few cycles of three different EODs here to illustrate this variation: a sinusoidal EOD (A. albifrons), a moderately complex EOD (P. hasemani), and a complex EOD (S. terminalis). Each EOD was combined with a temporally stretched copy of itself to generate a 10 Hz beat (middle column). The beat is shown on a longer timescale that encompasses many cycles of the interacting EODs. In the right column, the frequency trace shows the frequency modulation during the chirp (top), which translates into differing patterns of disruptions to the beat (bottom). Note the different frequency scales for each chirp.

