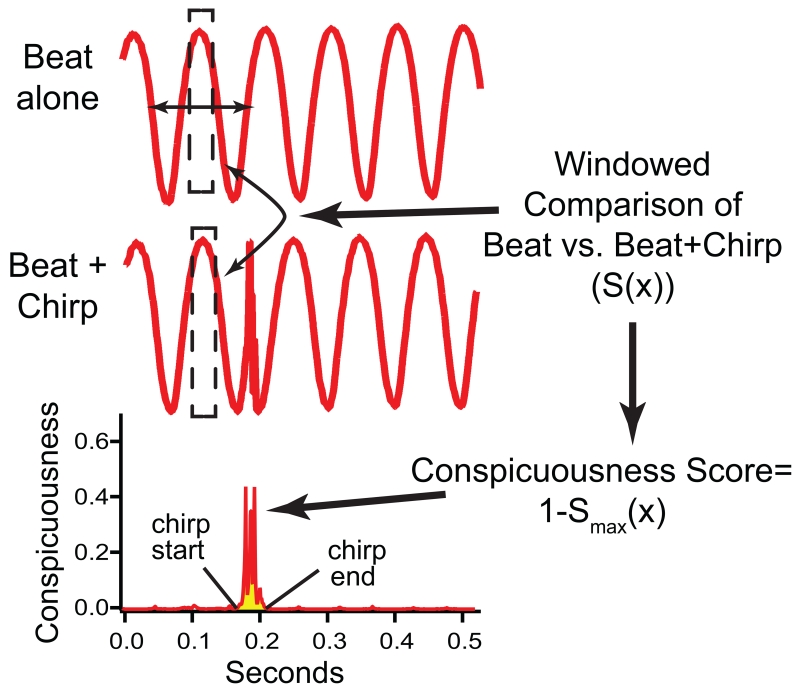
Fig. 4.
A simplified schematic of the chirp conspicuousness analysis. The AM (beat) of interacting EODs without a chirp is compared to the AM (beat) of the same EODs interacting with a chirp. The algorithm generates a conspicuousness score that is based on a windowed comparison between the beat alone vs. the beat containing the chirp (S(x), see Methods). The conspicuousness score is plotted across the duration of the signal. We report here peak conspicuousness (the maximal point in this plot) and sum conspicuousness (the area under the curve during the time that the sampling window overlaps the chirp, shaded in yellow here). Note that the red traces shown are the AM, not the original EOD. The specific parameters of the chirp displayed here caused the beat to be shifted in phase after the chirp compared to the unperturbed beat. In other words, the two signals are in phase before the chirp but nearly anti-phase after the chirp. Chirp duration and frequency jointly determine how much phase shift the chirp causes.

