Figure 2.


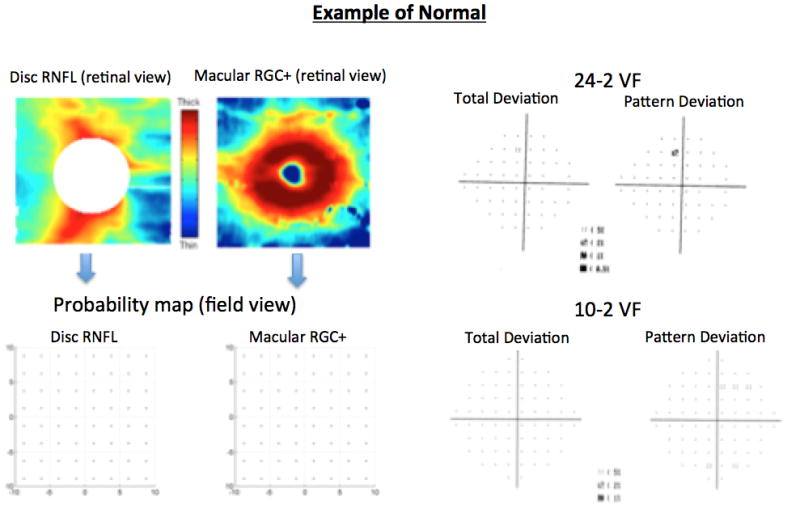
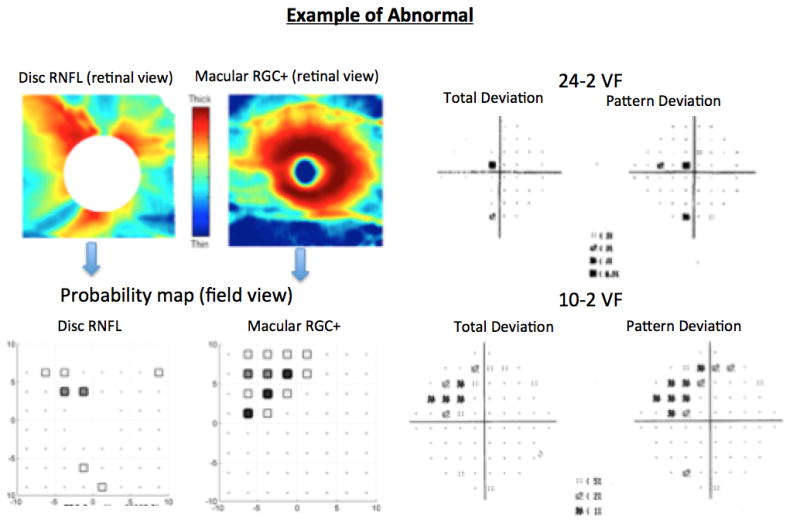
Examples of each group: normal (OCT and VFs normal); abnormal (both the 24-2VF and disc cube OCT and/or both 10-2VF and macula cube OCT were abnormal in the same hemifield).


Examples of each group: normal (OCT and VFs normal); abnormal (both the 24-2VF and disc cube OCT and/or both 10-2VF and macula cube OCT were abnormal in the same hemifield).