
Figure 8.
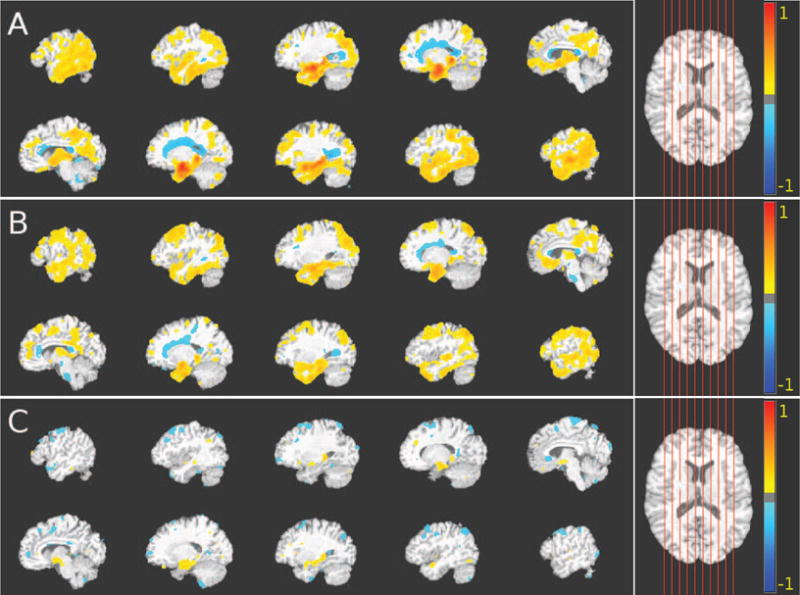
Comparison between group differences obtained using commonly applied monistic analysis and the results that were obtained using our method for heterogeneity detection in genetic data. The voxel-based analysis was performed using GM RAVENS. Color-maps indicate the scale for the t-statistic. Images are displayed in radiological convention. Axial views of the VBA results obtained from GM group comparisons of (A) CN vs. first AD subgroup; (B) CN vs. second AD subgroup; and (C) first AD subgroup vs. second AD subgroup are shown. For (A) and (B), colder colors indicate relative GM volume increases (CN < AD subgroups), while warmer colors correspond to relative GM volume decreases (CN > AD subgroups). Similarly for (C), warmer colors indicate relative GM volume increases (first AD subgroup < second AD subgroup), while colder colors correspond to relative GM volume decreases (first AD subgroup > second AD subgroup). Both groups exhibit atrophy in the temporal lobe and posterior medial cortex while white matter lesions are present in the periventricular area. However, the first AD subgroup, which mainly comprises APOE ε4 carriers, is characterized by significantly more hippocampus and entorhinal cortex atrophy and less superior frontal lobe atrophy.