
Fig. 4.
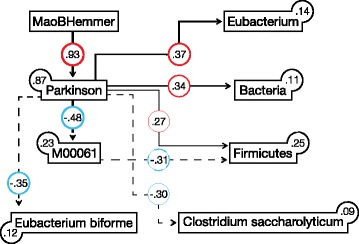
Structural equation modeling (SEM). SEM analysis of PD in relation to key correlating bacterial functions and taxa (MSEA = 0, PCLOSE = 0.79, AIC = 59.385). Values on paths and boxes are standardized regression and determination coefficients (R2), respectively. Dashed lines and red colors denote negative relationships. The thickness of lines is proportional to regression coefficients. All relationships are statistically significant (P < 0.05, Additional file 5). AIC Akaike information criterion, MSEA mean square error of approximation, PCLOSE probability of close fit